1. (1) Using Treasury Bonds Notes and Bills from the Wall... listing the coupon rate, maturity month and year, and the...
advertisement
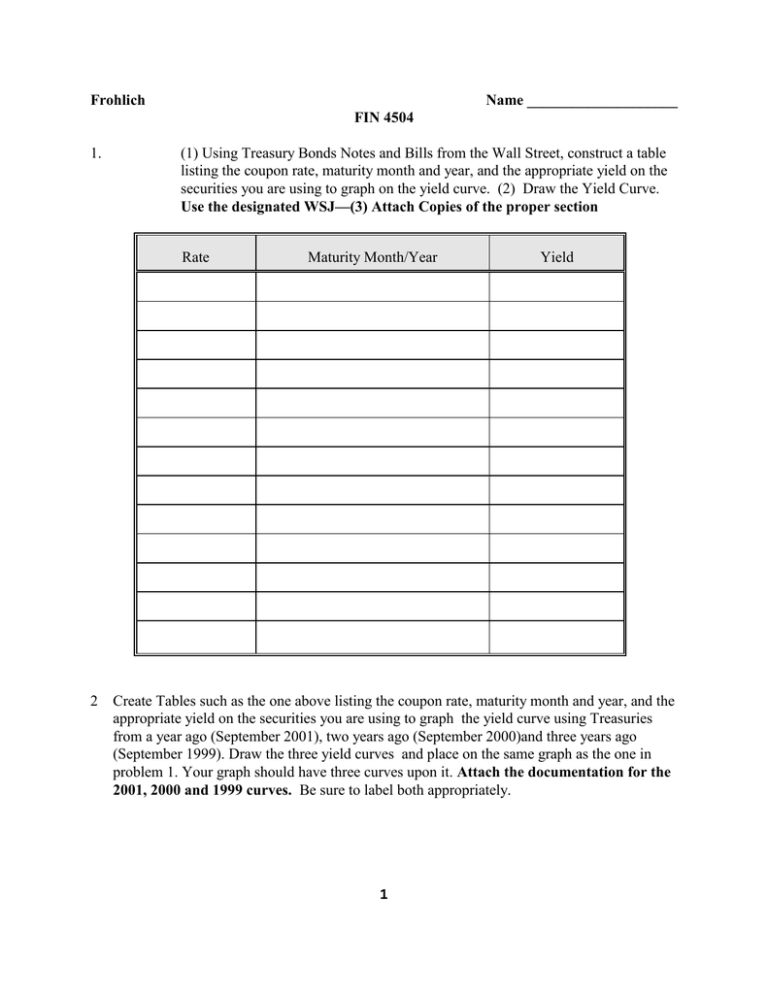
Frohlich Name ____________________ FIN 4504 1. (1) Using Treasury Bonds Notes and Bills from the Wall Street, construct a table listing the coupon rate, maturity month and year, and the appropriate yield on the securities you are using to graph on the yield curve. (2) Draw the Yield Curve. Use the designated WSJ—(3) Attach Copies of the proper section Rate 2 Maturity Month/Year Yield Create Tables such as the one above listing the coupon rate, maturity month and year, and the appropriate yield on the securities you are using to graph the yield curve using Treasuries from a year ago (September 2001), two years ago (September 2000)and three years ago (September 1999). Draw the three yield curves and place on the same graph as the one in problem 1. Your graph should have three curves upon it. Attach the documentation for the 2001, 2000 and 1999 curves. Be sure to label both appropriately. 1 3 Given the Yield Curves you've constructed in #1 and #2 explain the differences in the level of interest rates between the years using the Loanable Funds and the Liquidity Preference theory 4. Explain the shape of the 2002 curve using the unbiased expectation theory and the segmentation theory and its significance to the investor. 2 3


