Module 12 and 13 HW review.docx
advertisement
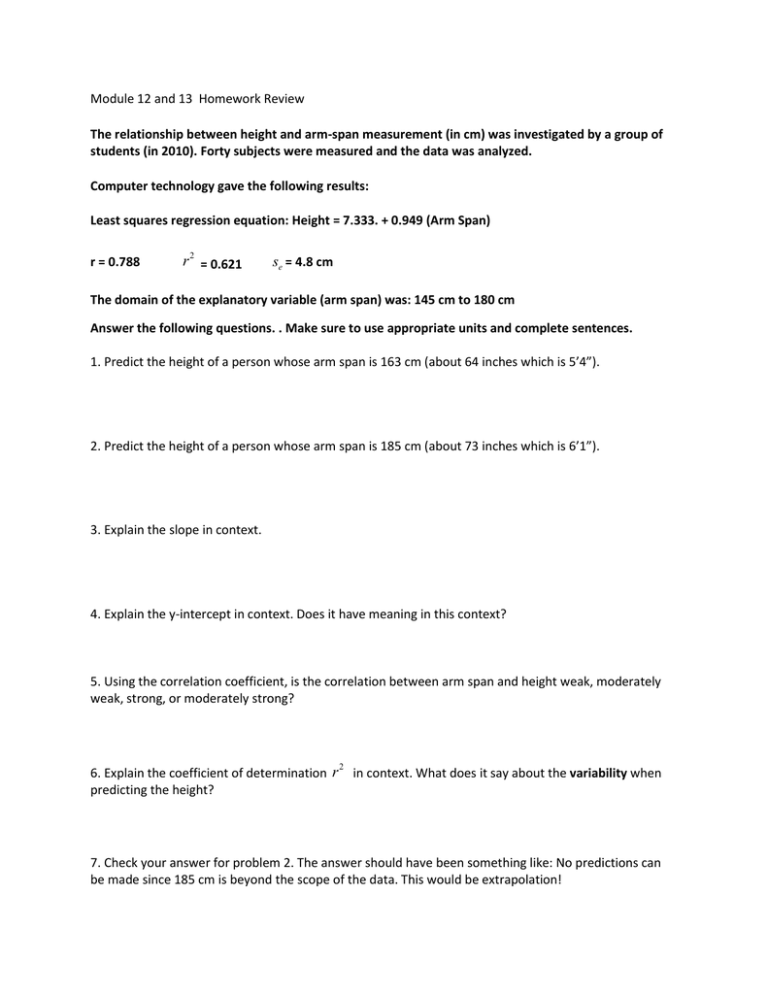
Module 12 and 13 Homework Review The relationship between height and arm-span measurement (in cm) was investigated by a group of students (in 2010). Forty subjects were measured and the data was analyzed. Computer technology gave the following results: Least squares regression equation: Height = 7.333. + 0.949 (Arm Span) r = 0.788 r 2 = 0.621 se = 4.8 cm The domain of the explanatory variable (arm span) was: 145 cm to 180 cm Answer the following questions. . Make sure to use appropriate units and complete sentences. 1. Predict the height of a person whose arm span is 163 cm (about 64 inches which is 5’4”). 2. Predict the height of a person whose arm span is 185 cm (about 73 inches which is 6’1”). 3. Explain the slope in context. 4. Explain the y-intercept in context. Does it have meaning in this context? 5. Using the correlation coefficient, is the correlation between arm span and height weak, moderately weak, strong, or moderately strong? 6. Explain the coefficient of determination r predicting the height? 2 in context. What does it say about the variability when 7. Check your answer for problem 2. The answer should have been something like: No predictions can be made since 185 cm is beyond the scope of the data. This would be extrapolation! The regression line for the Burger King data fits the data well: 8. What is the predicted fat content for a BK Broiler chicken sandwich that has 30g of protein? 9. The actual fat content ends up being 32.6g. What is the residual for the BK Broiler chicken sandwich? What does this mean (explain using complete sentences)? 10. The SE is 5 grams of fat. Interpret the meaning in context. 11. Interpret the slope and y-intercept in context to this problem (don’t just write what it came out to be). Don’t forget to also use appropriate units. Slope: y-intercept:
