Analyzing Linear Graphs: Video Notes & Examples
advertisement
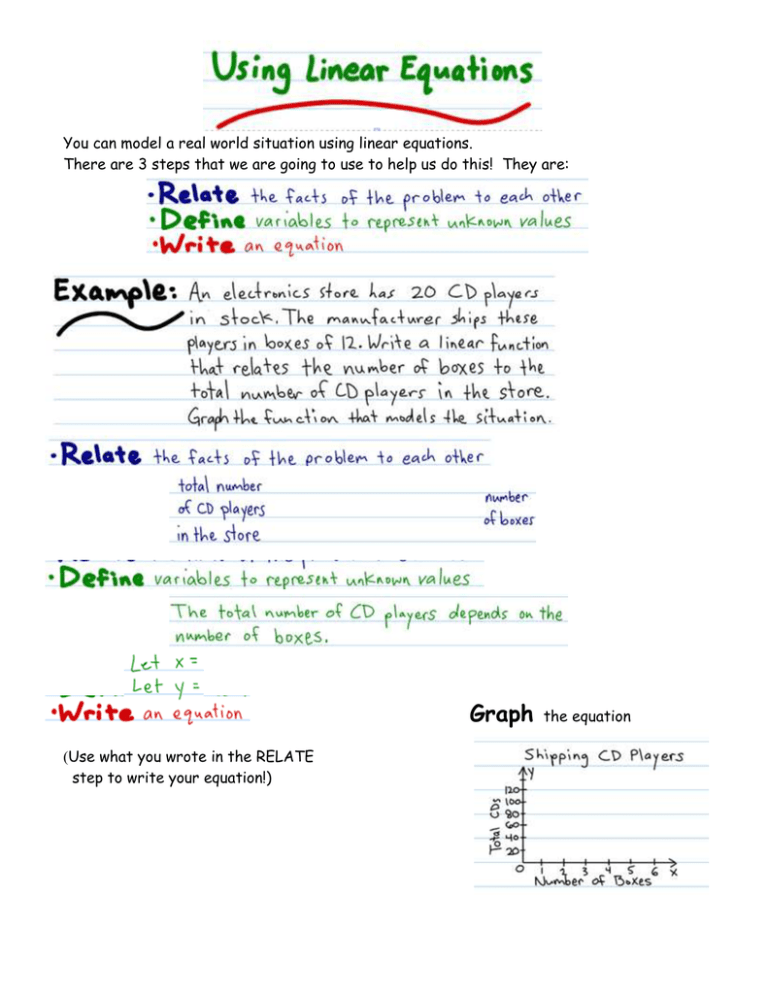
You can model a real world situation using linear equations. There are 3 steps that we are going to use to help us do this! They are: Graph (Use what you wrote in the RELATE step to write your equation!) the equation 6.3 Video Notes: Analyzing Linear Graphs Explain what the slope represents for this situation. What is the y-intercept of this graph? Explain what it means for this situation. So…how did you do??? Your slope is 8. So, your rate of jogging is 8 miles per hour. The y-intercept is 0. That means you traveled zero miles before you started to jog!
