hmuspan2.doc
advertisement
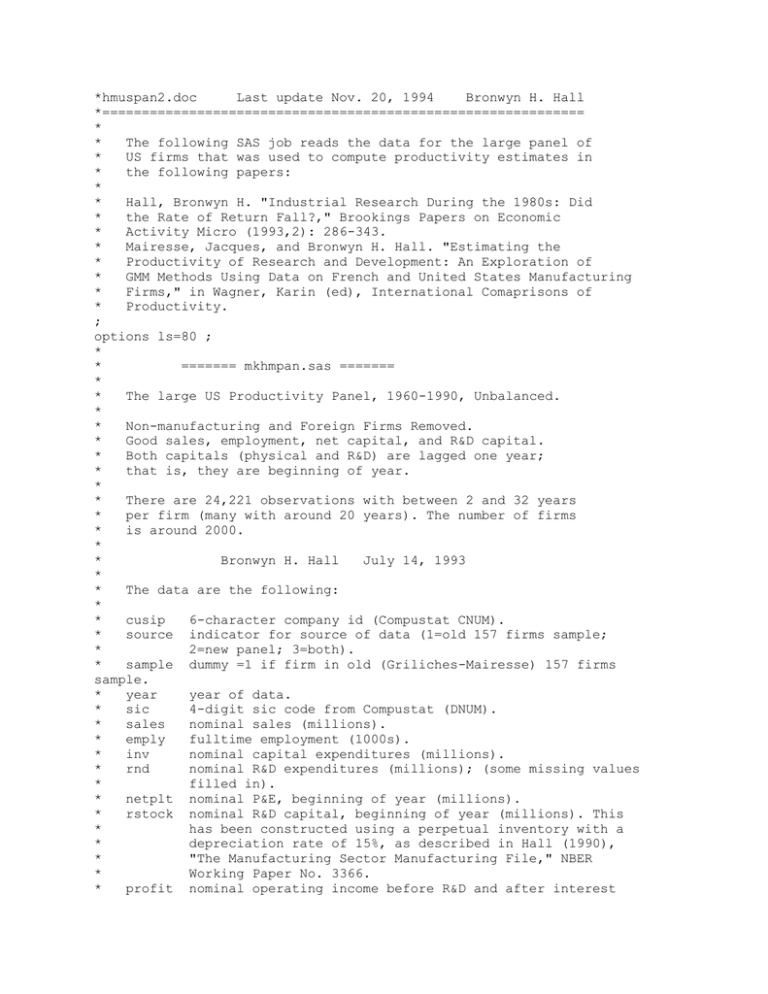
*hmuspan2.doc Last update Nov. 20, 1994 Bronwyn H. Hall *============================================================= * * The following SAS job reads the data for the large panel of * US firms that was used to compute productivity estimates in * the following papers: * * Hall, Bronwyn H. "Industrial Research During the 1980s: Did * the Rate of Return Fall?," Brookings Papers on Economic * Activity Micro (1993,2): 286-343. * Mairesse, Jacques, and Bronwyn H. Hall. "Estimating the * Productivity of Research and Development: An Exploration of * GMM Methods Using Data on French and United States Manufacturing * Firms," in Wagner, Karin (ed), International Comaprisons of * Productivity. ; options ls=80 ; * * ======= mkhmpan.sas ======= * * The large US Productivity Panel, 1960-1990, Unbalanced. * * Non-manufacturing and Foreign Firms Removed. * Good sales, employment, net capital, and R&D capital. * Both capitals (physical and R&D) are lagged one year; * that is, they are beginning of year. * * There are 24,221 observations with between 2 and 32 years * per firm (many with around 20 years). The number of firms * is around 2000. * * Bronwyn H. Hall July 14, 1993 * * The data are the following: * * cusip 6-character company id (Compustat CNUM). * source indicator for source of data (1=old 157 firms sample; * 2=new panel; 3=both). * sample dummy =1 if firm in old (Griliches-Mairesse) 157 firms sample. * year year of data. * sic 4-digit sic code from Compustat (DNUM). * sales nominal sales (millions). * emply fulltime employment (1000s). * inv nominal capital expenditures (millions). * rnd nominal R&D expenditures (millions); (some missing values * filled in). * netplt nominal P&E, beginning of year (millions). * rstock nominal R&D capital, beginning of year (millions). This * has been constructed using a perpetual inventory with a * depreciation rate of 15%, as described in Hall (1990), * "The Manufacturing Sector Manufacturing File," NBER * Working Paper No. 3366. * profit nominal operating income before R&D and after interest * deduction (a measure of cash flow available for investment) * (millions). * groplt nominal gross P&E, beginning of year (millions). * kgam,kfgam ignore. * * All values are nominal, and for the fiscal year of data (see * Compustat for details). ; data hmuspan2 ; file "hmuspan2.dat" ; put (cusip source sample year sic sales emply inv rnd netplt rstock profit groplt kgam kfgam) ($6. 3*3.0 5.0 4*12.5/6*12.5) ;
