Acceleration
advertisement
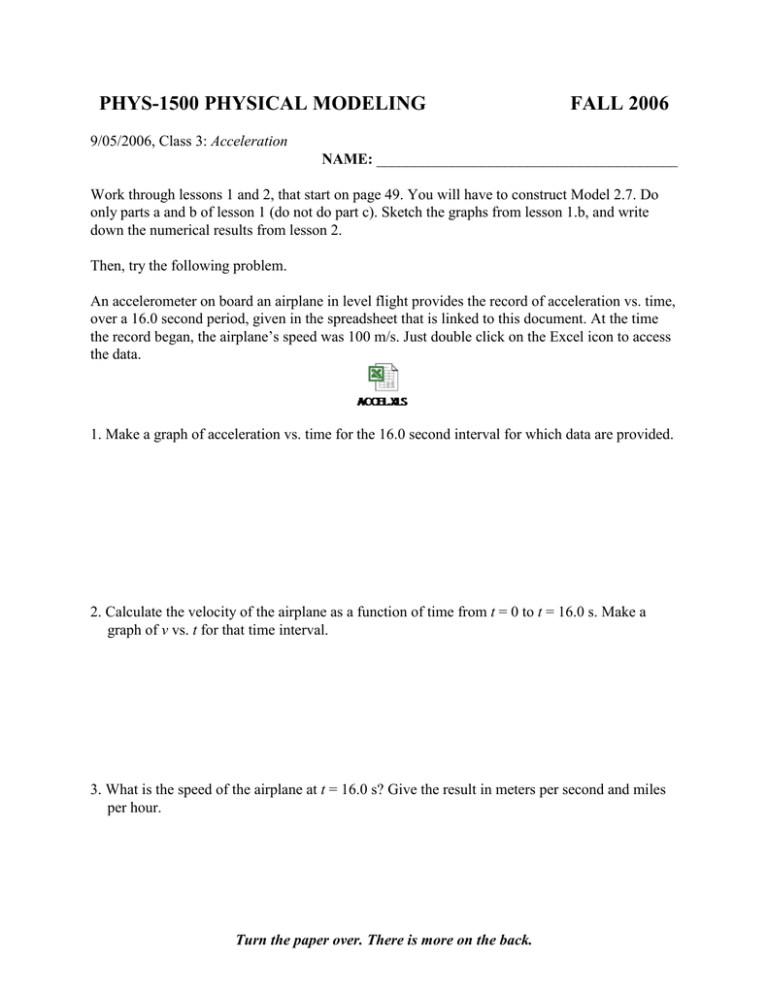
PHYS-1500 PHYSICAL MODELING FALL 2006 9/05/2006, Class 3: Acceleration NAME: ________________________________________ Work through lessons 1 and 2, that start on page 49. You will have to construct Model 2.7. Do only parts a and b of lesson 1 (do not do part c). Sketch the graphs from lesson 1.b, and write down the numerical results from lesson 2. Then, try the following problem. An accelerometer on board an airplane in level flight provides the record of acceleration vs. time, over a 16.0 second period, given in the spreadsheet that is linked to this document. At the time the record began, the airplane’s speed was 100 m/s. Just double click on the Excel icon to access the data. 1. Make a graph of acceleration vs. time for the 16.0 second interval for which data are provided. 2. Calculate the velocity of the airplane as a function of time from t = 0 to t = 16.0 s. Make a graph of v vs. t for that time interval. 3. What is the speed of the airplane at t = 16.0 s? Give the result in meters per second and miles per hour. Turn the paper over. There is more on the back. 4. Calculate the distance the airplane has traveled as a function of time from t = 0 to t = 16.0 s. Make a graph of x vs. t for that time interval. 5. How far did the airplane travel in the 16.0 second interval? Express the answer in miles as well as meters.
