PHYS-1500 PHYSICAL MODELING ...
advertisement
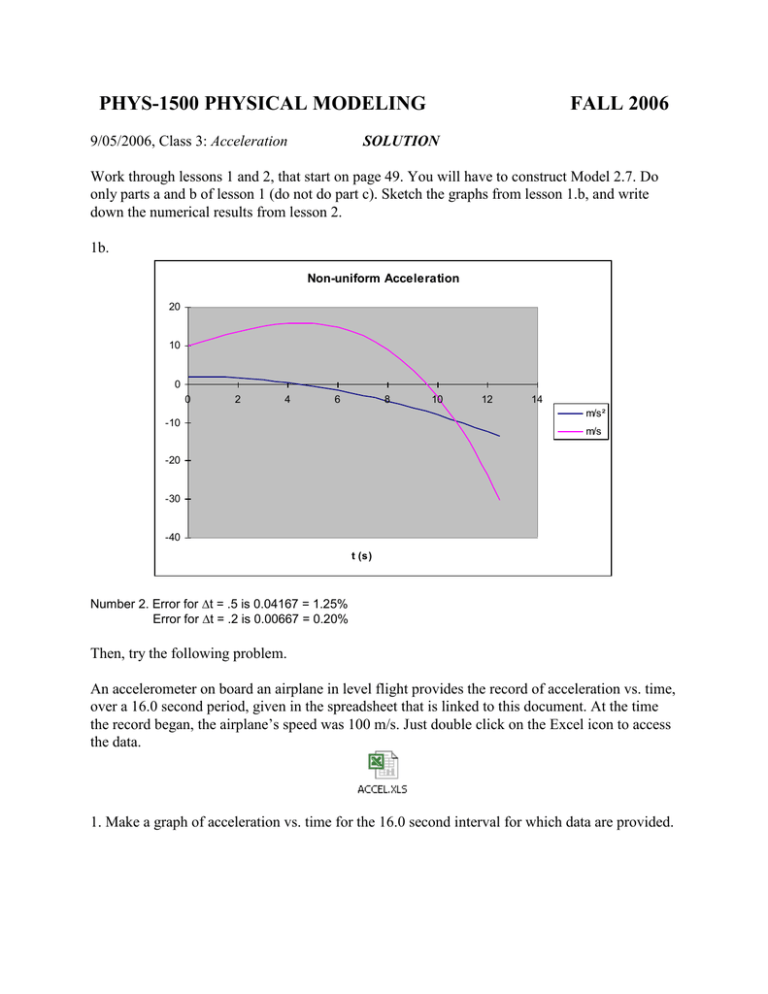
PHYS-1500 PHYSICAL MODELING 9/05/2006, Class 3: Acceleration FALL 2006 SOLUTION Work through lessons 1 and 2, that start on page 49. You will have to construct Model 2.7. Do only parts a and b of lesson 1 (do not do part c). Sketch the graphs from lesson 1.b, and write down the numerical results from lesson 2. 1b. Non-uniform Acceleration 20 10 0 0 2 4 6 8 10 12 14 m/s² -10 m/s -20 -30 -40 t (s) Number 2. Error for t = .5 is 0.04167 = 1.25% Error for t = .2 is 0.00667 = 0.20% Then, try the following problem. An accelerometer on board an airplane in level flight provides the record of acceleration vs. time, over a 16.0 second period, given in the spreadsheet that is linked to this document. At the time the record began, the airplane’s speed was 100 m/s. Just double click on the Excel icon to access the data. 1. Make a graph of acceleration vs. time for the 16.0 second interval for which data are provided. Accelerometer 6.00 a (m/s²) 5.00 4.00 3.00 2.00 1.00 0.00 0.00 5.00 10.00 15.00 20.00 t (s) 2. Calculate the velocity of the airplane as a function of time from t = 0 to t = 16.0 s. Make a graph of v vs. t for that time interval. Velocity 170.00 160.00 v (m/s) 150.00 140.00 130.00 120.00 110.00 100.00 0.00 5.00 10.00 15.00 20.00 t (s) 3. What is the speed of the airplane at t = 16.0 s? Give the result in meters per second and miles per hour. v = 157.85 m/s = 353.58 mi/h 4. Calculate the distance the airplane has traveled as a function of time from t = 0 to t = 16.0 s. Make a graph of x vs. t for that time interval. Displacement 2500.00 x (m) 2000.00 1500.00 1000.00 500.00 0.00 0.00 5.00 10.00 15.00 20.00 t (s) 5. How far did the airplane travel in the 16.0 second interval? Express the answer in miles as well as meters. x = 2020.85 m = 1.26 mi
