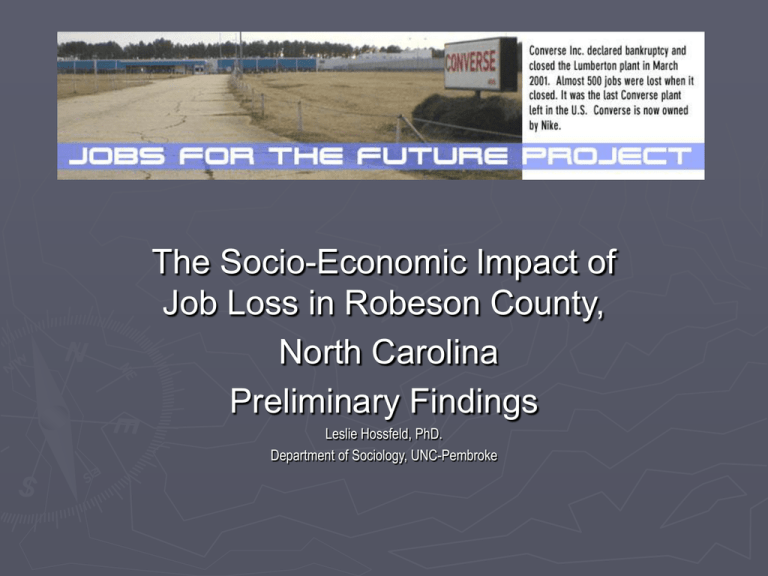
The Social and Economic Impact of Job Loss in Robeson County: Jobs for the Future
advertisement

The Socio-Economic Impact of Job Loss in Robeson County, North Carolina Preliminary Findings Leslie Hossfeld, PhD. Department of Sociology, UNC-Pembroke Robeson County, NC Population 123,339 Robeson County Population by Race US Census 2000 38% 40% 33% 25% 30% 20% 5% 10% 0% Native White African Latino Asian American American 1% Ten-Year Change in Robeson County Manufacturing 1993-2003 ► ► ► In 1993 manufacturing accounted for 31% of all jobs in the county Ten years later, manufacturing accounts for only 18% of jobs in the county. Nearly 9000 jobs lost since 1993 Peak years of plant closings 1998-2003 31% 27% 35% % in Manufacturing ► 21% 30% 18% 25% 20% 15% 10% 5% 0% 1990 2000 2002 2003 Source: NC Employment Security Commission 18,000 $350 $300 14,000 $250 12,000 10,000 $200 8,000 $150 6,000 Million Number of Employees 16,000 $100 4,000 $50 2,000 0 $0 1994199519961997199819992000200120022003 Number of Manufacturing Employees and Manufacturing Payroll - Robeson County 1993-2003 Source: County Business Patterns 1994-2003 ► Manufacturing work declined significantly from 17,430 in 1993 to 6,832 in 2003. Economic Impact of Manufacturing Job Loss Ripple Effect of Job Loss Regional Economic Impact (region defined as adjacent commuting counties) Total Cumulative Loss as of 2004 $4.8 billion Loss of 8,708 manufacturing jobs in Robeson County resulted in: Total reduction in regional employment of 19,922 jobs from 1993-2004 By 2004, regional household income had been reduced by $808 million By 2004 regional governments were collecting $39 million less in indirect business taxes; total cumulative 12 year impact: What happens when work disappears? ► Job loss affects not only the immediate worker who loses their job, but other workers in the community. Ripple effect on other industries due to manufacturing job loss Sample of Trade Related Job Losses 1993-2003 Lost Jobs Lost Income in Dollars Banking -148 -13,680,181 Eating & Drinking -637 -9,245,275 Wholesale Traders -495 -22,567,266 Motor Freight -475 -17,466,318 Gov Education -637 -20,660,867 Gov Non-Education -411 -16,450,228 -51 -2,349,769 -100 -4,427,898 US Postal Service Hospital ► Annual Unemployment Insurance to County Residents $ in Millions 25 20.8 20 ► 15 10 8.4 9.7 10.5 12.1 12.5 8.8 9.4 5 ► 0 1994 1995 1996 1997 1998 1999 2000 2001 Unemployment Insurance Payments Robeson County Source: US Bureau of Economic Analysis 1993-2001 Unemployment Insurance payments increased from $8.4 million in 1994 to $20.8 million in 2001 From 1998 to 2001 Unemployment Insurance payments more than doubled By June 2003 NC had a negative UIF balance Income Per Capita Income State and County US Census 2000 $25,000 $20,307 $20,000 “Poverty means you can’t do basic goals like taking care of your family and yourself” $15,000 $13,223 $10,000 $5,000 $0 Robeson County State Mean Household Income by Race 2000 Robeson County ► State Mean Household Income = $51,225 37% of Robeson County households in 2000 had incomes below $20,000 a year ► Over half (52%) earned incomes below $30,000 ► 24% of households live in poverty ► 50,000 43,612 39,327 40,000 34,330 36,579 27,932 30,000 20,000 10,000 0 White Black Hispanic Native All Races American Source: US Census 2000 Personal Bankruptcies Filed in US Eastern North Carolina District Courts 1994-2002 16,000 14,000 12,000 10,000 8,000 6,000 4,000 2,000 0 1994 1995 1996 1997 1998 1999 2000 2001 2002 Personal Bankruptcies Source: US Eastern North Carolina District Court 1994-2002 ►Personal bankruptcies in Eastern NC nearly tripled from 1994 to 2002 All Bankruptcies US District Court Robeson County 455 500 498 466 345 400 Bankruptcies Filed in Robeson County 1999-2002 300 200 Source: US Eastern North Carolina District Court 100 0 1999 2000 2001 2002 Education and Work ► 65% ► 70% 60% 50% 40% 11% 30% 20% 10% 0% High School Bachelors Robeson County Educational Attainment Source: US Census 2000 ► Many workers in Robeson County left school early to work in local manufacturing 31% of adults 25 and older in Robeson County do not have a high school diploma. Displaced workers face the dilemma of having little educational attainment when work today is increasingly knowledgebased Older workers are disadvantaged ► ► Rural displaced workers are generally older workers with less education Previous research on displaced workers indicates that older workers endure greater hardships with longer periods of unemployment than younger workers 50% 50% 30% 40% 30% 35-54 years of age 20% 10% 0% Population Employed Workforce Source: US Census 2000 ► Contact Information: Leslie Hossfeld, Ph.D. Department of Sociology BA 223 University of North Carolina at Pembroke hossfeld@uncp.edu ► Center for Community Action Mac Legerton PO Box 723 Lumberton, NC 28359 cca@carolina.net NATIONAL CONFERENCE ON JOB LOSS AND RECOVERY IN RURAL AMERICA The Center for Community Action Jobs for the Future Collaborative NATIONAL CONFERENCE ON JOB LOSS & RECOVERY IN RURAL AMERICA Southeastern North Carolina Agricultural Center and Farmer’s Market Hwy 74 East Lumberton, NC October 1 - 2, 2004


