Slides: Chapter 2: Biogeography and Evolution in the Tropics
advertisement

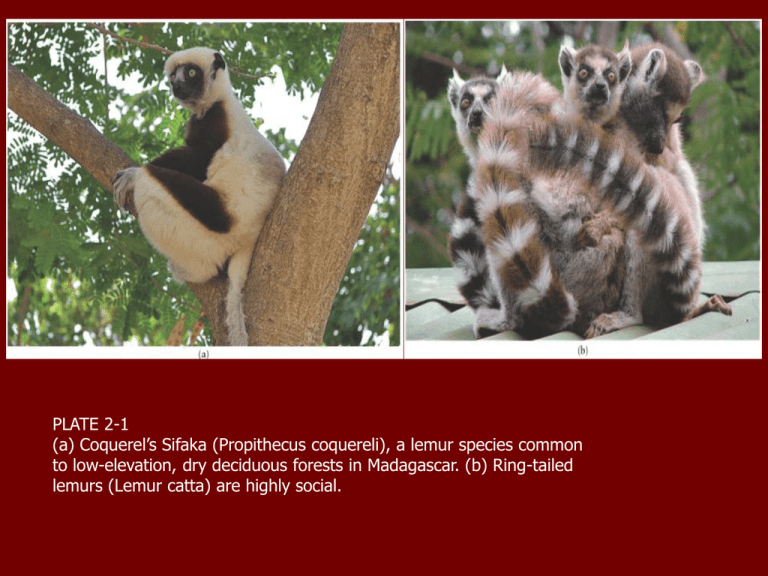
PLATE 2-1 (a) Coquerel’s Sifaka (Propithecus coquereli), a lemur species common to low-elevation, dry deciduous forests in Madagascar. (b) Ring-tailed lemurs (Lemur catta) are highly social. FIGURE 2-2 Wallace’s Line was originally developed by Alfred Russel Wallace based on the distribution of animal groups. Those typical of tropical Asia occur on the west side of the line; those typical of Australia and New Guinea occur on the east side of the line. FIGURE 2-7 The mid-Atlantic ridge is part of the extensive ridge system that characterizes areas where new seafloor comes to the surface. PLATE 2-9 The three-toed sloth (Bradypus variegatus) is well adapted to an arboreal life but poorly adapted to being on the ground. FIGURE 2-9 This cladogram, based on genetic similarity, illustrates that the savanna and forest elephants are about as different from one another as either is from an Asian elephant. FIGURE 2-10 This is an example of a cladogram—in this case, for primates. The shorter the distance from branch to branch, the more closely related are the species. For example, note the top of the cladogram. Tamarins and marmosets are each other’s closest relatives. FIGURE 2-11 Beginning with T1, note how a vicariant event such as a mountain rising may separate populations geographically, thus allowing for genetic differences to develop over time between the now-isolated populations. At time T4, the populations again become partially sympatric and selection pressures act to enhance their separation. At time T5, there are reproductive-isolating mechanisms that select to prevent hybridization and to maintain the two populations as full species. FIGURE 2-12 This map shows the location of the three major lakes of the Great Rift Valley in Africa. PLATE 2-13 Cichlid fish of the Great Rift Valley lakes demonstrate an amazingly high species richness. PLATE 2-14 The complex topography of the Andes Mountain chain has resulted in numerous vicariant speciation events throughout the full range of the Andes. FIGURE 2-14 (a) The range of Baird’s tapir. Note that it occurs throughout Central America and on the most western side of the Andes in Colombia and Ecuador. (b) The range of the lowland tapir. FIGURE 2-16 The cladogram on the left depicts relationships among a group of hummingbird species of the genus Metallura (the metaltail hummingbirds). The cladogram is based on comparisons of sections of mitochondrial DNA, a commonly used index to ascertain degrees of genetic relationship. The colored squares correspond to the ranges of the various species shown in color on the map. Species differ in elevation as well as geographic location. The dashed line indicates two million years, so the cladogram depicts a group of recently evolved species. Note the high rate of genetic differentiation occurring in the Tyrian metaltail, shown in the lower cladogram, and note the extensive range of that species shown in the map. FIGURE 2-21 This figure illustrates the principal groups of mammals involved with the Great American Interchange that resulted in mixing the mammalian (and other animal) faunas of North and South America once the Isthmus of Panama became exposed approximately 3 million years ago. The upper maps illustrate how the positions of the Americas changed from the late Cretaceous through the Miocene, bringing the continents sufficiently close that when glaciation occurred, the land bridge was established. FIGURE 2-23 Smilodon (left) and Thylacosmilus (right) were both morphologically similar, particularly regarding the enlarged saber-like canine teeth. But Smilodon was a placental mammal, whereas Thylacosmilus was a marsupial mammal. Their similarity is a clear case of convergent evolution.


