TABLE 1
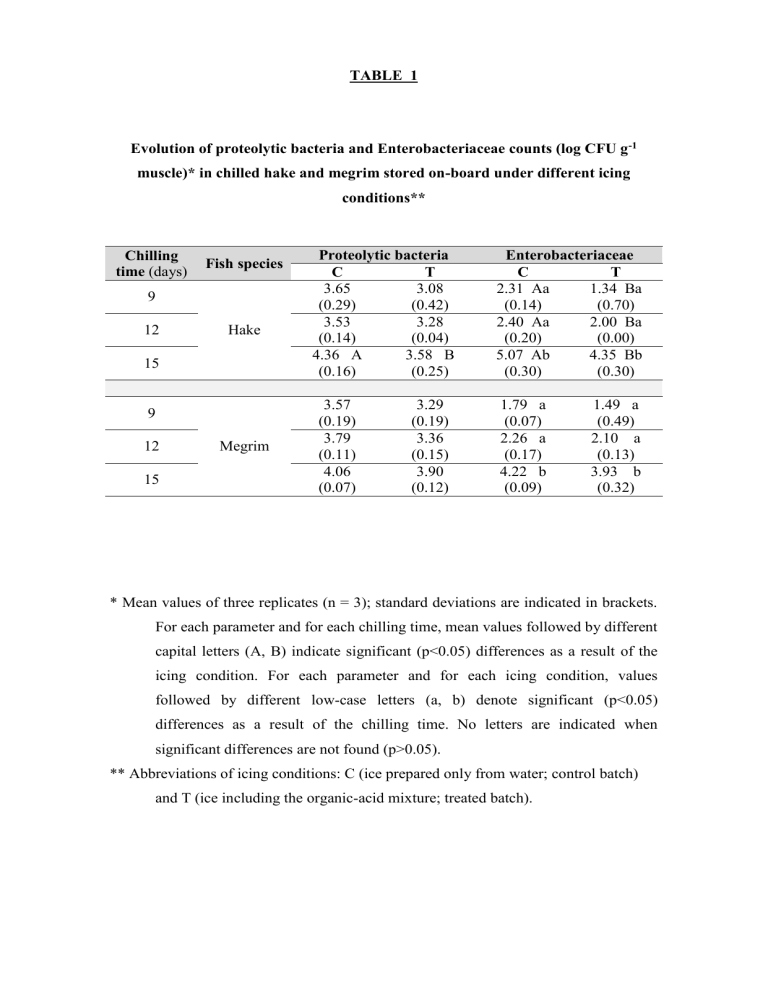
TABLE 1
Evolution of proteolytic bacteria and Enterobacteriaceae counts (log CFU g -1 muscle)* in chilled hake and megrim stored on-board under different icing conditions**
Chilling time (days)
9
12
15
Fish species
Hake
Proteolytic bacteria
C T
3.65
(0.29)
3.08
(0.42)
3.53
(0.14)
4.36 A
(0.16)
3.28
(0.04)
3.58 B
(0.25)
Enterobacteriaceae
C T
2.31 Aa
(0.14)
1.34 Ba
(0.70)
2.40 Aa
(0.20)
5.07 Ab
(0.30)
2.00 Ba
(0.00)
4.35 Bb
(0.30)
9
12
15
Megrim
3.57
(0.19)
3.79
(0.11)
4.06
(0.07)
3.29
(0.19)
3.36
(0.15)
3.90
(0.12)
1.79 a
(0.07)
2.26 a
(0.17)
4.22 b
(0.09)
1.49 a
(0.49)
2.10 a
(0.13)
3.93 b
(0.32)
* Mean values of three replicates (n = 3); standard deviations are indicated in brackets.
For each parameter and for each chilling time, mean values followed by different capital letters (A, B) indicate significant (p<0.05) differences as a result of the icing condition. For each parameter and for each icing condition, values followed by different low-case letters (a, b) denote significant (p<0.05) differences as a result of the chilling time. No letters are indicated when significant differences are not found (p>0.05).
** Abbreviations of icing conditions: C (ice prepared only from water; control batch) and T (ice including the organic-acid mixture; treated batch).
TABLE 2
Evolution of chemical indices* related to quality loss in chilled hake and megrim stored on-board under different icing conditions**
Chilling time
(days)
9
12
15
Fish species
Hake
Total volatile bases value
(TVB; mg TVB-N kg
-1
muscle)
C
234.4 a
(3.9)
252.3 ab
(18.5)
282.1 b
(18.3)
T
241.2 a
(5.8)
251.5 b
(15.2)
274.4 c
(3.3)
Trimethylamine value (TMA; mg
TMA-N kg -1 muscle)
C
2.1 a
(0.7)
26.6 Bb
(1.5)
75.3 Bc
(17.0)
T
2.0 a
(1.2)
16.6 Ab
(6.8)
48.5 Ac
(1.2)
K Value
(%)
C
14.58 a
(2.44)
23.55 b
(4.08)
28.31 Bb
(3.20)
T
16.61 a
(2.03)
22.05 b
(2.63)
21.87 Ab
(2.59)
9
12
15
Megrim
196.1 a
(2.4)
258.2 b
(8.6)
236.8 b
(15.7)
196.3 a
(6.2)
260.1 b
(20.5)
244.6 b
(19.9)
3.6 a
(0.8)
52.1 Bb
(3.3)
63.8 b
(17.4)
2.3 a
(0.6)
42.9 Ab
(4.9)
55.8 b
(10.7)
20.73 a
(2.62)
23.15 a
(5.43)
39.22 b
(4.37)
22.59 a
(2.03)
24.40 a
(1.71)
36.86 b
(3.05)
* Mean values of three replicates (n = 3); standard deviations are indicated in brackets.
For each parameter and for each chilling time, mean values followed by different capital letters (A, B) indicate significant (p<0.05) differences as a result of the icing condition. For each parameter and for each icing condition, values followed by different low-case letters (a, b, c) denote significant (p<0.05) differences as a result of the chilling time. No letters are indicated when significant differences are not found (p>0.05).
** Abbreviations of icing conditions as expressed in Table 1.
TABLE 3
Assessment of sensory acceptance* in chilled hake and megrim stored on-board under different icing conditions**
Sensory descriptor
Chilling time
(days)
C
Hake
T C
Megrim
Skin
Eyes
9
12
15
9
12
15
9
12
A
A
B
A
B
B
A
B
B
External odour
Gills
Consistency
Muscle odour
(raw)
15
9
12
15
9
12
15
9
12
15
9
B
B
B
B
C
B
B
B
B
B
A
A
A
A
A
B
B
B
B
Muscle odour
(cooked)
Muscle taste
(cooked)
12
15
9
12
15
B
C
B
A
A
A
B
A
B
* Quality categories: E (excellent), A (good), B (fair) and C (unacceptable).
A
B
A
A
B
B
B
A
A
A
A
A
B
A
A
A
A
A
A
T
A
A
A
** Abbreviations of icing conditions as expressed in Table 1.

