Tablas.doc
advertisement
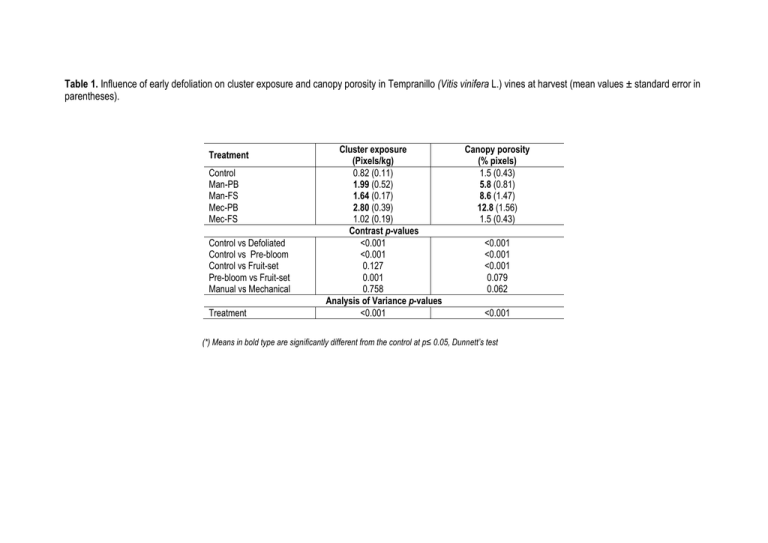
Table 1. Influence of early defoliation on cluster exposure and canopy porosity in Tempranillo (Vitis vinifera L.) vines at harvest (mean values ± standard error in parentheses). Treatment Control Man-PB Man-FS Mec-PB Mec-FS Control vs Defoliated Control vs Pre-bloom Control vs Fruit-set Pre-bloom vs Fruit-set Manual vs Mechanical Treatment Cluster exposure (Pixels/kg) 0.82 (0.11) 1.99 (0.52) 1.64 (0.17) 2.80 (0.39) 1.02 (0.19) Contrast p-values <0.001 <0.001 0.127 0.001 0.758 Analysis of Variance p-values <0.001 Canopy porosity (% pixels) 1.5 (0.43) 5.8 (0.81) 8.6 (1.47) 12.8 (1.56) 1.5 (0.43) <0.001 <0.001 <0.001 0.079 0.062 <0.001 (*) Means in bold type are significantly different from the control at p≤ 0.05, Dunnett’s test Table 2. Influence of early defoliation on the total soluble solids and acidity parameters of Tempranillo (Vitis vinifera L.) musts in season 2008 (mean values ± standard error in parentheses). Treatment Control Man-PB Man-FS Mec-PB Mec-FS Control vs Defoliated Control vs Pre-bloom Control vs Fruit-set Pre-bloom vs Fruit-set Manual vs Mechanical Treatment Total soluble solids pH (º Brix) 22.0 (0.65) 3.10 (0.01) 24.3 (0.38) 3.08 (0.02) 23.0 (0.33) 2.99 (0.01) 25.0 (0.21) 3.14 (0.02) 23.5 (0.38) 3.07 (0.04) Contrast p-values <0.001 0.282 <0.001 0.727 0.024 0.028 0.003 0.003 0.209 0.005 Analysis of Variance p-values <0.001 0.003 Titratable acidity (g/l TH2) 5.40 (0.35) 5.52 (0.28) 5.34 (0.22) 4.76 (0.27) 4.86 (0.27) (*) Means in bold type are significantly different from the control at p≤ 0.05, Dunnett’s test. 0.386 0.461 0.396 0.888 0.040 0.049 Table 3. Influence of early defoliation on the oenological parameters of Tempranillo wine in season 2008. Mean values, standard errors, analysis of variance and contrasts’ significance are shown. % Ethanol (v/v) pH Titratable acidity (g/l TH2) Malic acid (g/l) Colour density Hue Total polyphenol index Control 12.8 (0.23) 3.82 (0.04) 5.23 (0.23) 3.04 (0.45) 10.1 (0.90) 0.68 (0.05) 46.0 (5.03) Man-PB 13.5 (0.15) 3.86 (0.05) 5.94 (0.22) 3.21 (0.09) 12.3 (1.05) 0.74 (0.02) 53.5 (2.46) Man-FS 13.2 (0.08) 3.83 (0.02) 5.70 (0.02) 2.83 (0.23) 11.6 (1.01) 0.62 (0.03) 47.2 (1.33) Mec-PB 13.3 (0.15) 3.97 (0.06) 5.22 (0.16) 3.04 (0.05) 15.3 (1.17) 0.76 (0.02) 60.5 (3.49) Mec-FS 13.2 (0.05) 3.89 (0.07) 5.45 (0.17) 2.59 (0.39) 15.9 (1.57) 0.64 (0.53) 55.1 (5.12) Treatment Contrasts’ p-values Control vs. Defoliated 0.004 0.249 0.213 0.646 0.006 0.824 0.050 Control vs. Pre-bloom <0.001 0.143 0.249 0.752 0.011 0.085 0.020 Control vs. fruit-set 0.051 0.526 0.264 0.259 0.013 0.191 0.277 Pre-bloom vs. fruit set 0.686 0.322 0.988 0.085 0.991 <0.001 0.131 Manual vs. Mechanical 0.791 0.100 0.057 0.391 0.003 0.506 0.049 0.024 0.010 0.045 Analysis of Variance-p values Treatment 0.030 0.075 <0.001 0.151 (*) Means in bold type are significantly different from the control at p≤ 0.05, Dunnett’s test Table 4. Influence of early defoliation on the volatile compounds of Tempranillo wines. Compound Family Type Treatment Control Control Man-PB Man-FS Mec-PB Mec-FS vs Defoliated 0.084 1-Hexanol 847.3 632.6 716.9 578.0 779.9 C6-compounds 0.273 (E)-3-hexen-1-ol 24.3 19.7 16.6 19.0 23.4 0.026 (Z)-3-hexen-1-ol 94.0 65.0 74.2 51.9 85.0 0.423 1-propanol 153.8 113.7 854.2 199.7 220.8 0.911 2-methyl-1-propanol 3519 2873.1 3975.4 2830.6 4117.8 0.632 1-butanol 243.2 229.3 426.8 248.1 264.2 Alcohols 0.450 2+3methyl-1-butanol 32370.1 26014.1 31429.4 22977.3 33055 0.112 3-methyl-1-pentanol 35.7 23.2 34.5 16.4 30.8 0.714 2-phenylethanol 6356.7 6269.2 6136.7 7222.9 6822.9 0.741 Ethyl butyrate 57.1 76.2 57.2 46.4 61.1 ND 0.832 Ethyl 2-methylbutyrate 553.0 509.2 723.4 848.3 0.942 Ethyl hexanoate 63.6 61.0 64.3 58.8 67.3 Ethyl esters 0.301 Ethyl lactate 789.4 418.8 501.7 388.9 925.0 ND 0.134 Ethyl octanoate 5.7 14.8 19.4 16.7 0.110 Diethyl succinate 245.2 238.8 148.9 193.1 124.6 3-methylbuthyl acetate 62.4 341.3 176.1 218.8 67.4 0.044 ND ND 0.486 Hexyl acetate 8.9 7.9 15.6 Acetates 0.030 2-phenylethyl acetate 325.5 528.4 350 611.1 394.9 ND 0.048 2+3-methylbutyric acid 54.0 44.7 37.3 35.6 0.420 Hexanoic 132.7 128.7 96 182.6 196.3 Volatile acids 0.190 Octanoic acid 88.1 95.0 78.7 243 194.6 0.037 Decanoic acid ND 16.5 ND 89.9 77.3 Linalool 0.808 Terpenes 11.1 8.6 8.4 12.1 12.1 Mean values in g/l; ND: not detected; Means in bold type are significantly different from the control at p0.05. Dunnett’s test. Contrast p-values Control Control Pre-bloom vs vs Pre-bloom vs Fruit-set Fruit-set 0.020 0.339 0.043 0.269 0.386 0.764 0.002 0.182 0.010 0.989 0.104 0.039 0.461 0.559 0.096 0.961 0.322 0.179 0.169 0.995 0.082 0.009 0.560 0.008 0.645 0.851 0.728 0.703 0.836 0.826 0,968 0,720 0,677 0.752 0.835 0.499 0.090 0.813 0.041 0.028 0.507 0.042 0.451 0.010 0.013 0.005 0.247 0.023 0.003 <0.001 0.305 0.479 0.001 0.002 0.231 0.004 0.014 0.426 0.515 0.859 0.159 0.340 0.553 0.037 0.091 0.585 0.814 0.842 0.966 Manual vs Mechanical 0.914 0.402 0.941 0.178 0.882 0.410 0.931 0.364 0.207 0.090 0.007 0.952 0.272 0.014 0.245 0.110 0.306 0.431 0.014 <0.001 0.001 <0.001 0.110 Table 5. Influence of early defoliation on the volatile composition of Tempranillo wines Treatment Compound families Contrast p-values Control Man-PB Man-FS Mec-PB Mec-FS Control vs Defoliated Control vs Pre-bloom Control vs Fruit-set Pre-bloom vs Fruit-set Manual vs Mechanical 965.6 713.8 807.7 648.9 888.2 0.075 0.017 0.317 0.058 0.906 Alcohols 42678.5 35522.6 42857.0 33495.0 44511.5 0.576 0.245 0.876 0.096 0.969 Ethyl esters 1714.0 1318.8 791.5 1427.3 2026.5 0.354 0.289 0.547 0.555 0.047 Acetates 396.9 877.6 526.1 845.5 462.3 0.028 <0.001 0.243 <0.001 0.723 Volatile acids 274.8 284.9 212.0 551.1 468.2 0.197 0.134 0.403 0.382 <0.001 Terpenes 11.1 8.6 8.4 12.1 12.1 0.808 0.814 0.842 0.966 0.110 C6-compounds Mean values in g/L; ND: not detected; Means in bold type are significantly different from the control at p0.05, Dunnett’s test. Table 6. Odour Activity Value (OAV) of volatile compounds in Tempranillo wines from different early defoliation treatments. Compound Family type Ethyl-2-methylbutyrate Ethyl octanoate Diethyl succinate 2-phenylethylacetate 3-methylbutyl acetate 2+3metoxybutyric acid Hexanoic acid Ethyl esters Acetates Volatile acids Odour Activity Value Odour threshold Odour Descriptor Control Man-PB Man-FS Mec-PB Mec-FS Sig. 18 fruity 30.72a 28.29a 0.00b 40.19a 47.13a ** 5 apple, sweetish 1.14a 2.97b 3.87b 3.35b 0.00c *** 200 fruity 1.23a 1.19a 0.74a 0.97a 0.62b * 250 rose, honey 1.30a 2.11b 1.40a 2.44b 1.58a ** 30 banana 2.08a 11.38b 5.87a 7.29a 2.25a * 34 cheese, old hops 1.59a 1.31a 1.10a 1.05a 0.00b *** 420 cheese, sweaty 4.42a 4.29a 3.20a 6.09b 6.54b *** Odour descriptors an odour threshold are reported in the literature (Vilanova et al 2009, Duarte et al. 2010). Statistical significance of treatments is given by (*) p=0.05, (**) p = 0.01, (***) p= 0.001 and (ns) not significant. Mean values within columns were separated by LSD test (p=0.05). Dissimilar letters across a row of treatment means indicate a statistically significant difference between those means.
