here for statistics example
advertisement
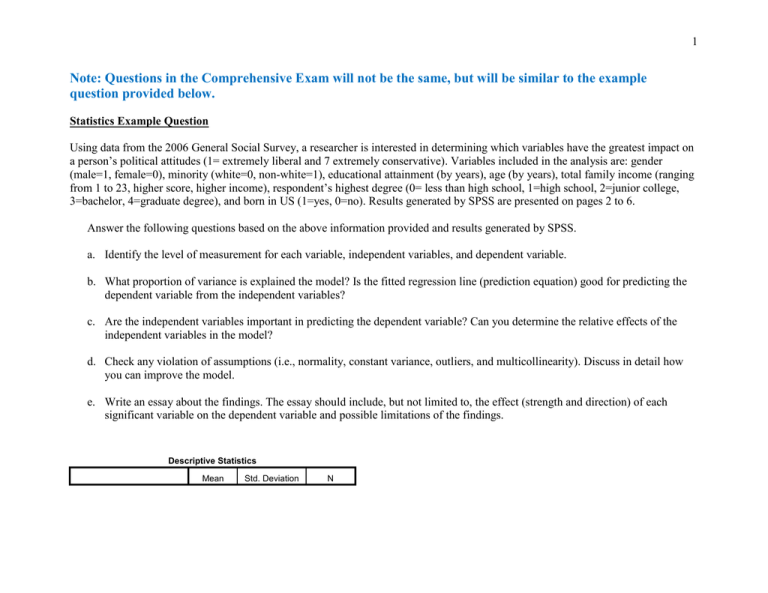
1 Note: Questions in the Comprehensive Exam will not be the same, but will be similar to the example question provided below. Statistics Example Question Using data from the 2006 General Social Survey, a researcher is interested in determining which variables have the greatest impact on a person’s political attitudes (1= extremely liberal and 7 extremely conservative). Variables included in the analysis are: gender (male=1, female=0), minority (white=0, non-white=1), educational attainment (by years), age (by years), total family income (ranging from 1 to 23, higher score, higher income), respondent’s highest degree (0= less than high school, 1=high school, 2=junior college, 3=bachelor, 4=graduate degree), and born in US (1=yes, 0=no). Results generated by SPSS are presented on pages 2 to 6. Answer the following questions based on the above information provided and results generated by SPSS. a. Identify the level of measurement for each variable, independent variables, and dependent variable. b. What proportion of variance is explained the model? Is the fitted regression line (prediction equation) good for predicting the dependent variable from the independent variables? c. Are the independent variables important in predicting the dependent variable? Can you determine the relative effects of the independent variables in the model? d. Check any violation of assumptions (i.e., normality, constant variance, outliers, and multicollinearity). Discuss in detail how you can improve the model. e. Write an essay about the findings. The essay should include, but not limited to, the effect (strength and direction) of each significant variable on the dependent variable and possible limitations of the findings. Descriptive Statistics Mean Std. Deviation N 2 THINK OF SELF AS LIBERAL OR 4.11 1.434 1398 Gender .4435 .49697 1398 Minority .2639 .44093 1398 US .8612 .34583 1398 13.48 3.192 1398 TOTAL FAMILY INCOME 11.17 2.119 1398 AGE OF RESPONDENT 47.30 17.135 1398 RS HIGHEST DEGREE 1.59 1.186 1398 CONSERVATIVE HIGHEST YEAR OF SCHOOL COMPLETED Model Summaryb Model 1 R .201a R Square Adjusted R Std. Error of the Square Estimate .040 .036 1.408 a. Predictors: (Constant), RS HIGHEST DEGREE, AGE OF RESPONDENT, gender, US, TOTAL FAMILY INCOME, minority, HIGHEST YEAR OF SCHOOL COMPLETED b. Dependent Variable: THINK OF SELF AS LIBERAL OR CONSERVATIVE ANOVAa Model 1 Sum of Squares Regression 116.008 df Mean Square 7 16.573 F 8.354 Sig. .000b 3 Residual 2757.535 1390 Total 2873.543 1397 1.984 a. Dependent Variable: THINK OF SELF AS LIBERAL OR CONSERVATIVE b. Predictors: (Constant), RS HIGHEST DEGREE, AGE OF RESPONDENT, gender, US, TOTAL FAMILY INCOME, minority, HIGHEST YEAR OF SCHOOL COMPLETED Coefficientsa Model Unstandardized Coefficients Standardized t Sig. Collinearity Statistics Coefficients B (Constant) 4.136 .322 Gender .045 .076 Minority -.278 Beta Tolerance VIF 12.861 .000 .016 .593 .554 .985 1.016 .093 -.086 -2.997 .003 .846 1.181 .278 .119 .067 2.347 .019 .845 1.183 -.050 .022 -.111 -2.297 .022 .295 3.387 TOTAL FAMILY INCOME .015 .019 .022 .794 .427 .922 1.085 AGE OF RESPONDENT .007 .002 .087 3.249 .001 .952 1.051 RS HIGHEST DEGREE -.034 .058 -.028 -.591 .554 .301 3.320 US 1 Std. Error HIGHEST YEAR OF SCHOOL COMPLETED a. Dependent Variable: THINK OF SELF AS LIBERAL OR CONSERVATIVE 4 5 6
