12644240_NZARES conference paper 2012_David Evison et al..docx (7.916Mb)
advertisement
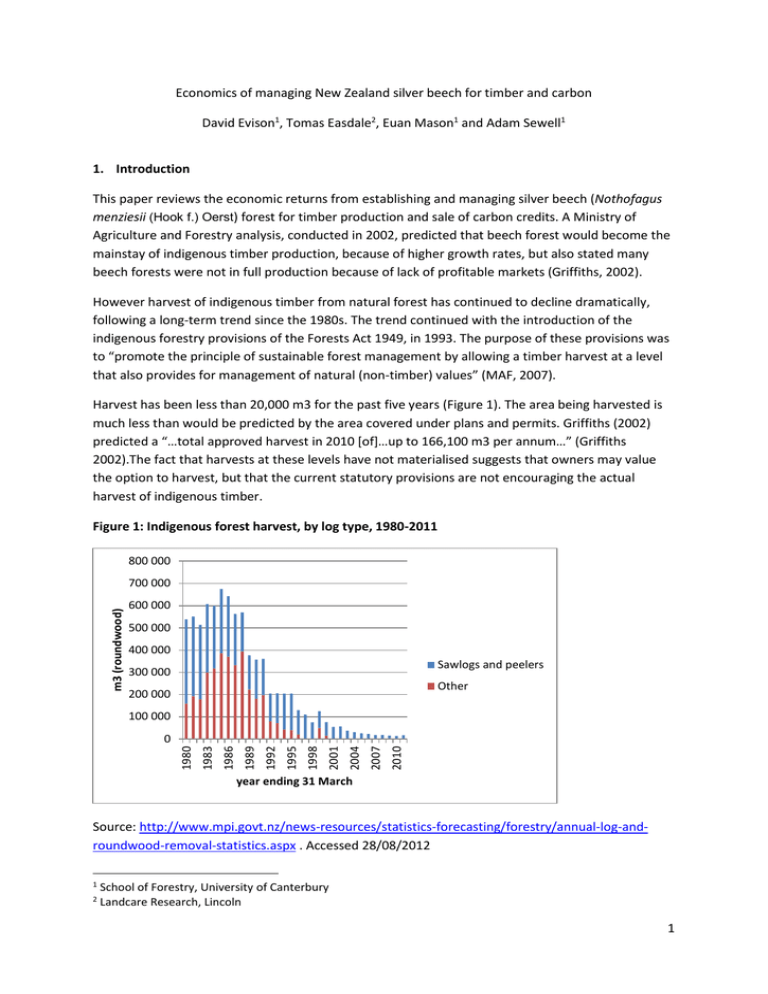
Economics of managing New Zealand silver beech for timber and carbon David Evison1, Tomas Easdale2, Euan Mason1 and Adam Sewell1 1. Introduction This paper reviews the economic returns from establishing and managing silver beech (Nothofagus menziesii (Hook f.) Oerst) forest for timber production and sale of carbon credits. A Ministry of Agriculture and Forestry analysis, conducted in 2002, predicted that beech forest would become the mainstay of indigenous timber production, because of higher growth rates, but also stated many beech forests were not in full production because of lack of profitable markets (Griffiths, 2002). However harvest of indigenous timber from natural forest has continued to decline dramatically, following a long-term trend since the 1980s. The trend continued with the introduction of the indigenous forestry provisions of the Forests Act 1949, in 1993. The purpose of these provisions was to “promote the principle of sustainable forest management by allowing a timber harvest at a level that also provides for management of natural (non-timber) values” (MAF, 2007). Harvest has been less than 20,000 m3 for the past five years (Figure 1). The area being harvested is much less than would be predicted by the area covered under plans and permits. Griffiths (2002) predicted a “…total approved harvest in 2010 [of]…up to 166,100 m3 per annum…” (Griffiths 2002).The fact that harvests at these levels have not materialised suggests that owners may value the option to harvest, but that the current statutory provisions are not encouraging the actual harvest of indigenous timber. Figure 1: Indigenous forest harvest, by log type, 1980-2011 800 000 m3 (roundwood) 700 000 600 000 500 000 400 000 Sawlogs and peelers 300 000 Other 200 000 100 000 2010 2007 2004 2001 1998 1995 1992 1989 1986 1983 1980 0 year ending 31 March Source: http://www.mpi.govt.nz/news-resources/statistics-forecasting/forestry/annual-log-androundwood-removal-statistics.aspx . Accessed 28/08/2012 1 2 School of Forestry, University of Canterbury Landcare Research, Lincoln 1 Baker and Benecke (2001) suggested that “…tree growth and increment in New Zealand’s beech forests has most probably been viewed too pessimistically in terms of economic performance for sustainable timber harvest…” The authors analysed growth trends in two thinning trials that were established in regenerating beech forests in 1965 and 1971. They concluded that “mean tree diameter of plots thinned heavily to 150 stems per hectare was twice the diameter of unthinned controls” and “there are large growth gains and significant potential for reduction in rotation lengths by heavy early thinning…” With the implementation of the Emissions Trading Scheme and the inclusion of forestry in the scheme, commentators have suggested that indigenous forests could be profitably grown to sequester carbon. The Afforestation Grant Scheme and the Permanent Forest Sink Initiative specifically included indigenous species (MAF, 2011). Maclaren and Manley et al. (2008) analysed the profitability of indigenous forest managed for carbon, and Davis et al. (2009), provided a summary of the costs of establishing various indigenous species on eroding grasslands. With the implementation of schemes that encourage the establishment of new forests, it is timely to review the economics of timber production and carbon sequestration from planted indigenous forests. 2. Data and Methods of Analysis The study uses growth data for thinned silver beech forest from a series of plots in Alton forest, Southland. The trial was established in the 1970s, in forest that naturally regenerated after clearfelling in 1951, to examine the impact of thinning and pruning on growth and yield of beech forest (Franklin 1981, Baker and Benecke 2001). The trial was thinned in 1971 and 1980, and Landcare Research and its predecessors measured the plots in 1971, 1974, 1977, 1980, 1982, 1985, 1995, 1999 and 2009. Subsequent analysis (Easdale et al., 2009) provided information on growth and yield under a range of thinning treatments and final stockings between approximately 8228 stems/ha and 150 stems/ha (Table 1). Timber volumes were calculated for nine measurement years (up to a stand age of 58 years) using the mature beech volume table described in Ellis (1979), and volumes for intermediate years were calculated by linear interpolation. Above-ground biomass was estimated using the general species biomass equation for New Zealand native trees derived from Beets (1980). The equation estimates stem wood mass and branch and leaf components based on tree height, diameter at breast height and species-specific wood density. Wood density was estimated from increment cores from 50 sample trees covering the range of diameter classes sampled from trees adjacent to the trials. Below-ground biomass was assumed to be 20 percent of total mass. Biomass was expressed as t/ha and then converted to carbon-stock using a conversion factor of 0.5. Establishment costs were derived from Davis et al., (2009), which describes alternative methods of establishing indigenous forest on eroding grassland - this is the most likely scenario for this analysis because in order to receive carbon credits, and for clear-felling to be permissible, this would need to be new indigenous forest. “…The most reliable method for establishing a range of indigenous species at various sites is introducing nursery-prepared plants, and knowledge on this method is considerable…” (Davis et al., 2009). Costs of establishing indigenous forests by these methods, and by direct seeding are generally very high (Table 1). They are significantly lower for natural 2 regeneration, with the major cost being fencing. In this report, fencing costs are based on a one hectare block. Fencing costs decline significantly as block size increases (Table 2). Note these costs include site preparation, pre-planting weed control, weed control for two years after establishment, fencing ($4000/ha) and pest control for 5 years from establishment. Where these costs are occur after planting they have been discounted at 7%. The analysis assumes that the forest is established by natural regeneration, and that it would be legally permissible to clear-fell the mature forest. Table 1: Present value of costs of establishment of native species and pine, assuming $4,000/ha for fencing (1 ha block) Totara Container seedling (PB2) Container seedling (Root-trainer) Bare root seedling Direct seeding Natural regeneration $27,751 $24,196 $15,530 $25,112 $4,091 Beech $27,751 $24,196 $15,530 N/A N/A Pine N/A N/A $6,025 $5,965 $4,021 Source: adapted from Davis et al. (2009) – only establishment costs are included, and the discount rate for costs not occurring at year 0 was changed to 7% to be consistent with the rest of the analysis Table 2: Present value of costs of establishment of native species and pine, assuming $800/ha for fencing (25 ha block) Totara Container seedling (PB2) Container seedling (Root-trainer) Bare root seedling Direct seeding Natural regeneration $24,551 $20,996 $12,330 $21,912 $891 Beech $24,551 $20,996 $12,330 N/A N/A Pine N/A N/A $2,825 $2,765 $821 Source: adapted from Davis et al. (2009) Establishment cost of $4,091 was used for this analysis. Other economic data were obtained from industry sources. Where possible, numbers from the indigenous industry were used; where data were not available from this source, typical numbers from the exotic plantation industry were used. A land rental of $25/ha/year was included in the annual costs of $100/ha/yr. Carbon administration costs of $14/ha/year were assumed. A discount rate of 7%, consistent with current commercial forestry rates (Manley, 2012) was used for the analysis. For the base case, an average log price of $150/m3 delivered at mill was assumed, and a carbon price of $13/tonne was used, being the approximate midpoint between the maximum and minimum prices since 2009 (see Figure 2 below). Other costs are shown below in Table 4. First thinning costs are based on scrub cutting costs assuming 22 hours labour per hectare. The second thinning cost was calculated from a tree-size dependent felling time, and a stocking related walk and select time, and a total labour cost of $33 / hour (Rien Visser, pers. comm.). No cost or value is ascribed to the pruning activity in the plots. For the options involving the ETS it was assumed that the total carbon liability would be paid at time of clear-felling, rather than deferring a 3 proportion of cost until residual carbon decayed. It is expected this assumption will only have a small impact on profitability, since carbon liability occurs in year 58. Figure 2: Historical carbon price (NZUs), 2009 - 2012 Source: Carbon Daily Report, 15 Jan 2013 Table 3: Thinning prescriptions (plots are sorted in descending order of final stocking). Plot Stocking 1971 (stems/ha) Stocking 1980 (stems/ha) 6 8228 8228 10 3000 3000 9 1500 1500 3 3000 750 1 3000 400 11 3000 400 7 1500 400 12 1500 400 2 8228 250 13 750 250 14 3000 250 15 1500 250 4 3000 150 5 1500 150 8 750 150 N.B. Stem densities in un-thinned stands (plots 2 and 6) were unknown and thus the value listed in the table above was estimated from a regression of stem densities (≥10cm dbh) in 2009 and 1980 for the other stands. Discounted cash flow analysis is used to determine the financial returns from timber harvest, and timber and carbon. 4 Table 4: Summary of costs included in each option Timber only Timber and carbon Carbon only Establish -ment $4,000 per ha √ √ √ Silvicultural costs (First thin $734, second thin $91 to $921 per ha √ √ √ Logging and transport ($64/m3) √ √ √ Annual costs ($100/ha /year) √ √ Carbon administration costs ($14/ha/year) Deforestation liability (100% of credits earned) √ √ √ 3. Results Volume recovery for logs ≥ 30 cm d.b.h. (merchantable volume in m3 per hectare) and carbon yield (tonnes of CO2e per hectare) were compared for each silvicultural treatment (see Figure 3). The treatments furthest from the origin are likely to be preferred because they provide the highest timber and carbon yields. For this reason Plots 9, 3 11 and 4 should receive the most attention. The data provide some support for the benefits of early and heavy thinning, although caution is advised since these are unreplicated trials. There are some anomalies – for example Plot 14 might be expected to lie between 11 and 4, but it performs much more poorly than 11 and 14. In general, maintaining a stocking of 3000 at first thinning, then reducing to somewhere between 750 an 150 depending on the emphasis on merchantable timber volume versus biomass production. Figure 3: Merchantable volume and CO2e sequestered, Alton Forest. 600 9: 1500/1500 500 3: 3000/750 6: 8228/8228 10: 3000/3000 C02 Equivalents (tonnes/ha) 400 11: 3000/400 1: 3000/400 13: 750/250 300 7: 1500/400 12: 1500/400 15: 1500/250 4: 3000/150 2: 8228/250 5: 1500/150 200 14 :3000/250 8: 750/150 100 0 0 20 40 60 80 100 120 140 160 Merchantable volume inside bark (m3/ha) N.B. Labels indicate plot number and stockings after thinning at age 20 and 29. 5 Discounted cash flow analysis was used to calculate net present value (NPV) for the range of silvicultural options represented in the Alton forest trial, and shown in Table 2 above. NPV is a decision tool to decide whether or not to invest in a project, at a given discount rate. In all cases cash flows over 58 years were included; while this is also the limit of the data, preliminary analysis indicated it was close to the optimal rotation for harvest for this species and site. In the case of the carbon only option, where there is no timber harvest, almost all of the present discounted value is included in the first 58 years. Table 5: NPV/ha for timber, carbon separately and both timber and carbon (58 years) Plot 1 2 3 4 5 6 7 8 9 10 11 12 13 14 15 Timber only -$5,529 -$5,463 -$5,518 -$5,500 -$5,571 -$5,461 -$5,586 -$5,560 -$5,505 -$5,579 -$5,506 -$5,505 -$5,525 -$5,563 -$5,522 Carbon only -$5,224 -$5,421 -$4,877 -$5,477 -$5,537 -$4,999 -$5,334 -$5,483 -$4,688 -$4,837 -$5,277 -$5,358 -$5,401 -$5,568 -$5,511 Timber and carbon -$5,200 -$5,392 -$4,855 -$5,359 -$5,494 -$5,108 -$5,295 -$5,401 -$4,625 -$4,821 -$5,098 -$5,191 -$5,247 -$5,380 -$5,314 The analysis shows that even the most promising options are highly unprofitable, and under standard investment rules, would not go ahead. Plot 6 is the best result for timber only, but NPVs for all plots vary by only 2% for the timber only option, so it could be assumed there is no significant difference in NPV. Plot 9 is best for carbon only, and for timber and carbon combined. A sensitivity analysis of Plot 9 (the plot that produces the highest merchantable timber yield), for timber only is shown in Figure 4. Establishment costs, annual costs and discount rate have the most effect on NPV. It also shows a surprising result with respect to discount rate – that is, when discount rate increases, NPV also increases (the typical result for most investments is that NPV decreases as discount rate increases). 6 Figure 4: Sensitivity analysis (timber only), Plot 9 -4500 -4700 -20% -10% Base case 10% 20% change in NPV ($/ha) -4900 -5100 -5300 discount rate -5500 log price thinning -5700 -5900 annual costs -6100 -6300 -6500 establishment Figure 5 below shows the response to discount rate across a wider range. The relationship between discount rate and NPV follows the expected trend up to a rate of 4%; at higher discount rates the relationship is the opposite of normal. Figure 5: Relationship between discount rate and NPV, timber only, Plot 9 -$1,000 0% 1% 2% 3% 4% 5% 6% 7% 8% 9% 10% 11% 12% 13% 14% 15% 16% 17% 18% 19% 20% $0 -$2,000 -$3,000 -$4,000 -$5,000 -$6,000 -$7,000 The reason for this behaviour can be seen from Figure 6. Because of the long rotations, the revenue declines much faster than annual costs, and approaches $0 above 10% discount rate, whereas the present value of annual costs does not tend towards zero. 7 Figure 6: Effect of discount rate on main components of NPV, timber only, Plot 9 10000 8000 6000 4000 Revenue 2000 Thinning 15% 14% 13% 12% 11% 9% 8% 7% 6% 5% 4% 3% 2% 10% -2000 1% 0% 0 Annual costs -4000 -6000 -8000 The effect of increasing log prices is shown in Figure 7. The aberrant trend in NPV with increasing discount rate still occurs, although as log prices increase, you have a normal trend for longer (at a log price of $550/m3 the minimum NPV is at 10%). Figure 7: Effect of log price and discount rate on NPV, timber only, Plot 9 $45,000 $40,000 $35,000 $30,000 $25,000 $150 $250 $20,000 $350 $15,000 $450 $550 $10,000 $5,000 $0 0% 1% 2% 3% 4% 5% 6% 7% 8% 9% 10% 11% 12% 13% 14% 15% -$5,000 -$10,000 8 If the NPV is also calculated at 0% we can immediately see those options that are fundamentally unsound – there can surely be no financial justification for accepting a long-term project where the cash costs exceed the revenues. Figure 8 below shows those options that are cash positive (or close to it), and confirms those treatment that are most promising financially. Figure 9: NPV of timber only at 0% discount rate $2,000 $0 1 2 3 4 5 6 7 8 9 10 11 12 13 14 15 -$2,000 -$4,000 -$6,000 -$8,000 -$10,000 4. Conclusion The NPV calculation is used in conjunction with a decision rule “if the NPV of the investment is greater than or equal to zero the investment should be undertaken”. If the NPV is less than zero then the rule simply says “don’t invest”, and there is usually very little further investigation of such projects. However with greater interest in non-timber benefits, which are almost always unpriced (and a general unwillingness of indigenous forestry enthusiasts to take “no” for an answer!), it is helpful to explore how to take the analysis further. A frequent criticism of DCF (particularly when it recommends rejection of a project that someone is keen on) is that discount rates are “too high”. Proponent of a particular project may level this criticism, if the results of the analysis don’t align with their wishes. The analysis of these types of investments should probably also include a calculation at 0% discount rate. If an investment loses money at 0% there is little justification for blaming the discount rate for rejection of the investment. This type of thinking was incorporated in the analysis above. It has also been found that, if a proposed investment is sufficiently poor, reducing the discount rate (within the normal range of commercial rates) simply makes it a worse investment. This impact of discount rate on NPV occurs because the impact of the discount rate is much larger on revenues that on annual costs. The analysis of losers can be used most beneficially to show how much critical economic values would need to change to make the investment worthwhile, for example: 9 1. What market value would need to be placed on timber to make indigenous timber forestry a “good” investment? 2. What is the shortfall (in terms of NPV) that would need to be made up by non-priced forest values, either as a lump sum or an annuity? If one wished to argue that the log prices don’t reflect the true value of indigenous timber, a tripling of average log price (to $NZ450 per m3) would mean the investment yielded about 3% real. This is about the same as a 1 year term deposit currently (August 2012), surely a much lower risk investment. In the case of Plot 9, timber only, the NPV is -$5,505/ha. For someone who invests in a silver beech forest and manages it in this way the above the lump sum is the cost of this investment. Alternatively it can be calculated as an annuity for 58 years, which means that the forest owner would have to get $393 per ha per year of value from the other forest outputs (non-timber) to make this an investment worth participating in. The option value of establishing a forest that might be able to be used for timber production at some later date if the price was suitable could also be considered. Or if there were cultural or spiritual values that the owner could ascribe to the utilisation of the timber a “hurdle value” for these could also be quantified. However, current public attitudes to harvesting indigenous forests for timber do not support ascribing a positive spiritual value to timber utilisation! A further issue with the analysis of projects that discounted cash flow analysis indicates should not proceed, is the paucity of good economic data. Naturally, because the option is unappealing from a financial viewpoint, there are not many people doing it! Because of the very small number of harvesting operations taking place, there are no published data. Existing companies may not be willing to share data, and many operations are not run as a commercial business. Establishment costs are also uncertain, but are likely to be much higher than rates for current commercial forests. These factors increase the difficulty of doing a credible analysis. The comparison of establishment costs using bare-rooted seedlings for indigenous species and pine in Tables 1 and 2 shows the benefits of improved technology and operational experience. The same comparison for direct seeding shows the benefits of scale. There may be no reason why these benefits could not also apply to the establishment of silver beech. This would improve the profitability of investment in silver beech, but if all other assumptions in the analysis above applied, would still be negative. In summary, when analysing the economics of establishing new indigenous forests for timber production, the combination of higher costs of establishment, lower yields, insufficient log prices and longer rotation ages results in an almost inevitable negative result. This does not mean that people should not establish new indigenous forests, it just means they should not do it expecting to get positive returns on their capital invested. 5. Acknowledgements This analysis was funded by, and utilised data collected and analysed by, Landcare Research Ltd. The support of Dr Rob Allen and Dr Susan Wiser is gratefully acknowledged. 10 6. References Baker, G. and Benecke, U., (2001). Growth response to silvicultural tending of red and silver beech regeneration. New Zealand Journal of Forestry, Vol 46, No. 3. Beets, P.N., 1980. Amount and distribution of dry matter in a mature beech/podocarp community. New Zealand J. For. Sci. 10, 395–418. Davis, M., Douglas, G., Ledgard, N., Palmer, D., Bhubaneswor, D., Paul T., Bergin, D., Hock, B., and Barton, I. (2009). Establishing indigenous forest on erosion-prone grassland: land areas, establishment methods, costs and carbon benefits. Ministry of Agriculture and Forestry, Wellington Easdale, T.A., Burrows, L.E., Henley, D., & Baker, G. (2009). Effects of thinning on silver beech growth. Landcare Research Contract Report: LC0910/015. Landcare Research, Lincoln Easdale T, Burrows L, Allen, R (2010). Thinning boosts merchantable timber yields of silver beech. Indigena, May issue: 3-4. Ellis, J. C. (1979). Tree volume equations for the major indigenous species in New Zealand: New Zealand Forest Service. Franklin D.A. (1981). A silvicultural regime for dense beech regeneration. FRI What’s New in Forest Research 98. 4 pp. Griffiths, A. D. (2002). Indigenous forestry on private land: present trends and future potential. MAF Technical Paper No 01/6, Ministry of Agriculture and Forestry, Wellington Maclaren, P., Manley, B., and Final Year School of Forestry Students (2008). Impact of New Zealand Emissions Trading Scheme on forest management. NZ Journal of Forestry, 53(3). MAF (2011). Review of MAF Afforestation Schemes: Permanent Forest Sink Initiative, Afforestation Grant Scheme, East Coast Forestry Project, Sustainable Land Management (Hill Country Erosion) Programme. Final Report of the Review Panel. Ministry of Agriculture and Forestry, Wellington. MAF (2007). Standards and Guidelines for the Sustainable Management of Indigenous Forests (3rd edition). MAF Policy, Wellington 11

