Student notes for power and effect sizes
advertisement

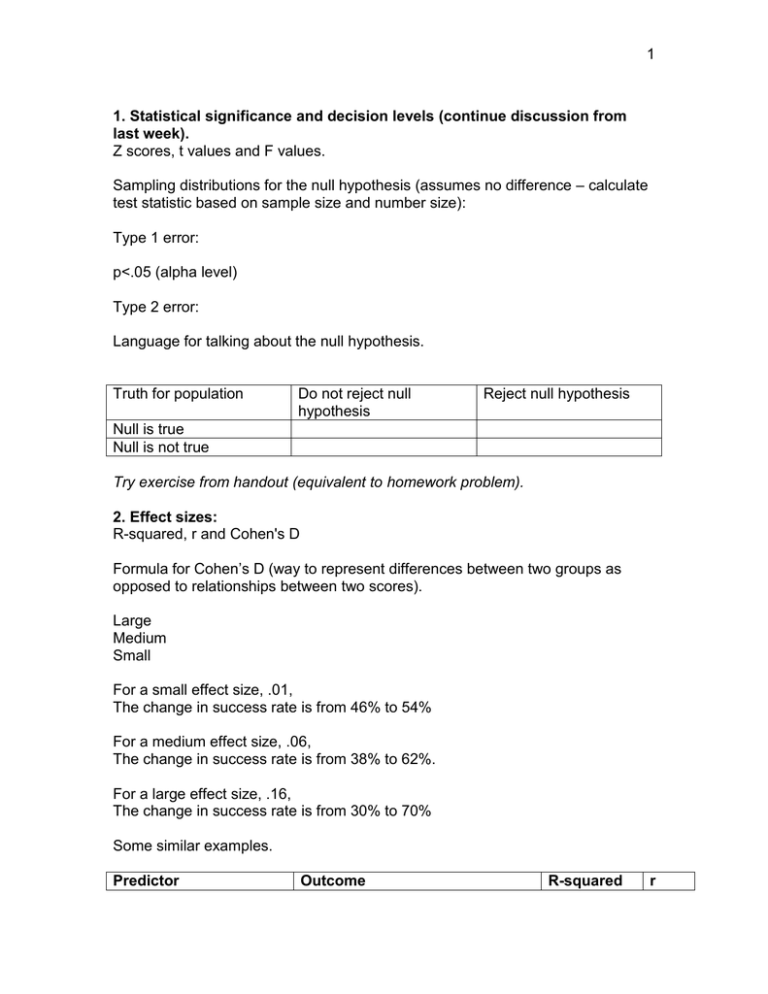
1 1. Statistical significance and decision levels (continue discussion from last week). Z scores, t values and F values. Sampling distributions for the null hypothesis (assumes no difference – calculate test statistic based on sample size and number size): Type 1 error: p<.05 (alpha level) Type 2 error: Language for talking about the null hypothesis. Truth for population Do not reject null hypothesis Reject null hypothesis Null is true Null is not true Try exercise from handout (equivalent to homework problem). 2. Effect sizes: R-squared, r and Cohen's D Formula for Cohen’s D (way to represent differences between two groups as opposed to relationships between two scores). Large Medium Small For a small effect size, .01, The change in success rate is from 46% to 54% For a medium effect size, .06, The change in success rate is from 38% to 62%. For a large effect size, .16, The change in success rate is from 30% to 70% Some similar examples. Predictor Outcome R-squared r 2 Vietnam veteran status Testosterone AZT Psychotherapy Alcohol abuse Juvenile delinquency Death improvement Meta-analysis: 3. Statistical power: probability that study will detect relationship if research hypothesis is correct. Required sample size for 80% statistical power (for p <.05) r=.10 r=.30 Two tailed One tailed Power: Power = 1 - type 2 error Power = 1 - beta How increase power? 1) 2) 3) 4) What determines power? 1. 2. 3. What is adequate power? How do you know how much power you have? r=.50 3 Two ways to use power: 1. 2. Study feature Practical way of raising power Disadvantages Sample Size Conclusion Predicted difference Standard deviation Standard deviation Sample size Significant level One tailed vs. two tailed test Outcome statistically significant Yes Yes No No 4 An example (after Shapiro & Shapiro, 1983). Is psychotherapy effective? Therapy target Anxiety & depression Phobias Physical and habit problems Social and sexual problems Performance anxieites Number of studies 30 76 106 76 126 Cohen’s D .67 .88 .85 .75 .71 r .31 .54 .52 .43 .37 R2 9.6% 29% 27% 18% 14% If you think that the effect is small (.01), medium, (.06) or large (.15), and you want to find a statistically significant difference defined as p<.05, this table shows you how many participants you need for different levels of “sensitivity” or power. Power -> Effect size | .01 .06 .15 .10 .20 .30 .40 .50 21 5 3 53 10 5 83 14 6 113 144 19 24 8 10 .60 .70 179 219 30 36 12 14 .80 .90 271 354 44 57 17 22 If you think that the effect is small (.01), medium, (.06) or large (.15), and you want to find a statistically significant difference defined as p<.01, this table shows you how many participants you need for different levels of “sensitivity” or power. Power -> Effect size | .01 .06 .15 Reject null hypothesis Do not reject null hypothesis .10 .20 .30 .40 70 13 6 116 20 8 156 26 11 194 232 32 38 13 15 Null hypothesis is false Merit pay works and we know it We decided merit pay does not work but it does. .50 .60 .70 274 323 45 53 18 20 .80 .90 385 478 62 77 24 29 Null hypothesis is true We decided merit pay worked, but it doesn’t. Merit pay does not work and we know it.


