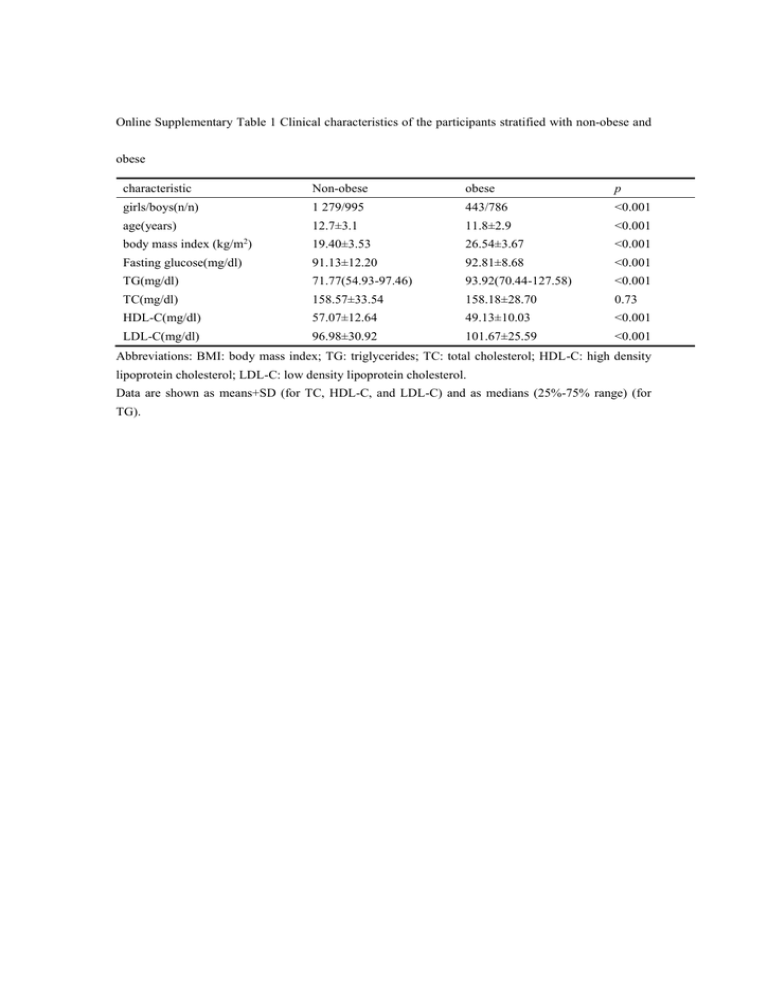
Online Supplementary Table 1 Clinical characteristics of the participants stratified...
advertisement

Online Supplementary Table 1 Clinical characteristics of the participants stratified with non-obese and obese characteristic Non-obese obese p girls/boys(n/n) 1 279/995 443/786 <0.001 12.7±3.1 11.8±2.9 <0.001 body mass index (kg/m ) 19.40±3.53 26.54±3.67 <0.001 Fasting glucose(mg/dl) 91.13±12.20 92.81±8.68 <0.001 TG(mg/dl) 71.77(54.93-97.46) 93.92(70.44-127.58) <0.001 TC(mg/dl) 158.57±33.54 158.18±28.70 0.73 HDL-C(mg/dl) 57.07±12.64 49.13±10.03 <0.001 LDL-C(mg/dl) 96.98±30.92 101.67±25.59 <0.001 age(years) 2 Abbreviations: BMI: body mass index; TG: triglycerides; TC: total cholesterol; HDL-C: high density lipoprotein cholesterol; LDL-C: low density lipoprotein cholesterol. Data are shown as means+SD (for TC, HDL-C, and LDL-C) and as medians (25%-75% range) (for TG). Online Supplementary Table 2 Clinical characteristics of dyslipidemia and nondyslipidemia characteristic non-dyslipidemia dyslipidemia p girls/boys(n/n) 1 256/1 248 464/526 0.08 age(years) 12.2±3.1 12.8±3.0 <0.001 body mass index (kg/m ) 21.19±4.67 23.71±5.16 <0.001 Fasting glucose(mg/dl) 91.14±9.21 93.17±14.83 <0.001 TG(mg/dl) 70.88(54.27-92.14) 114.29(81.51-164.80) <0.001 TC(mg/dl) 151.25±21.44 176.54±44.46 <0.001 HDL-C(mg/dl) 56.75±10.48 48.03±14.47 <0.001 LDL-C(mg/dl) 90.54±19.25 119.12±38.69 <0.001 2 Abbreviations: BMI: body mass index; TG: triglycerides; TC: total cholesterol; HDL-C: high density lipoprotein cholesterol; LDL-C: low density lipoprotein cholesterol. Data are shown as means+SD (for TC, HDL-C, and LDL-C) and as medians (25%-75% range) (for TG). Online Supplementary Table 3 Genotypes distribution and Hardy-Weinberg equilibrium test for seven SNPs genotypes SNP gene chr. Major /minor allele group C/C C/R R/R MAF (%) H-W-P rs2144300 GALNT2 1 C/T All 2 403 983 117 17 0.18 Boys 1 201 515 65 18 0.29 girls 1 202 468 52 17 0.43 All 1 063 1 694 746 45 0.14 Boys 533 864 384 46 0.33 girls 530 830 362 45 0.27 All 1 052 1 722 729 45 0.62 Boys 534 871 376 46 0.55 girls 518 851 353 45 0.92 All 2 373 1 020 110 18 0.98 Boys 1 202 526 53 18 0.62 girls 1 171 494 57 18 0.58 All 1 246 1 679 578 40 0.76 Boys 610 881 290 41 0.35 girls 636 798 288 40 0.16 rs1260333 rs1260326 rs10105606 rs2954029 GCKR GCKR LPL TRIB1 2 2 8 8 T/C T/C C/A T/A Chi square* p value* 2.70 0.26 0.35 0.84 0.21 0.90 0.561 0.75 3.66 0.16 rs1748195 rs964184 ANGPTL3 APOA5-A4-C3-A1 cluster 1 11 C/G C/G All 2 064 1 230 209 24 0.15 Boys 1 052 620 109 24 0.17 girls 1 012 610 100 24 0.52 All 2 121 1 208 174 22 0.91 Boys 1 087 606 88 22 0.77 girls 1 034 602 86 22 0.89 Abbreviations: MAF: minor allele frequency. H-W-P: p value for Hardy-Weinberg equilibrium test. C/C, homozygous for major allele; C/R, heterozygous for minor allele; R/R, homozygous for minor allele. * The Chi square and p values for comparing the genotype distribution between boys and girls were shown. 0.25 0.88 0.37 0.83 Online Supplementary Table 4 Results of power calculation for seven SNPs in Chinese pediatric population. Specific minor Major allele /minor SNP rs2144300 gene GALNT2 Chr. 1 allele C/T position 230,294,916 minor in allele CEU, CHB, MAF MAF C, 0.417 effect in T, 0.222 effect lipid trait HDL-C allele, allele, beta-coefficient per beta-coefficient per effect Power effect allele in children allele in adults (reference) (%) (Tikkanen et al., 2011) T, 1.11mg/dl (Willer et * a power for children (%) 87.7 G , -0.0158mmol/L 44.1 84.2 - - 99.8 - - 69.0 T, 0.0494mmol/L 69.1 >99.9 T, 0.0616(natural log) >99.9 al., 2008) TG C, 4.25mg/dl (Willer et al., 2008) rs1260333 GCKR 2 T/C 27,748,624 T, 0.415 C, 0.389 TG C, -0.054 (natural log) value (Waterworth et al., 2010) rs1260326 GCKR 2 T/C 27,730,940 T, 0.400 C, 0.400 TC C, -1.91mg/dl (Teslovich et al., 2010) TG C, -8.76mg/dl (Teslovich et al., 2010) C, -0.12 value s.d. units >99.9 - - 99.7 - - 99.7 A, 0.0401(natural log) 95.7 (Kathiresan et al., 2009) rs10105606 LPL 8 A/C 19,827,848 A, 0.276 A, 0.167 TG C, 0.067 (natural log) value (Waterworth et al., 2010) rs2954029 TRIB1 8 T/A 126,490,972 T, 0.383 A, 0.411 TG A, 5.64mg/dl (Teslovich et al., 2010) T, -0.04 (natural log) value (Waterworth et al., value 95.6 - - 2010) LDL-C T, -0.015 (natural log) 59.8 - - >99.9 - - 99.9 - - value (Waterworth et al., 2010) TG T, -0.11 s.d. units (Kathiresan et al., 2009) rs1748195 ANGPTL3 1 G/C 63,049,593 G, 0.325 G, 0.233 TG C, 7.12 mg/dl (Willer et al., 2008) rs964184 APOA5-A4- 11 G/C 116,648,917 G, 0.108 G, 0.244 TC - - Tb, 0.0672mmol/L 73.1 LDL-C - - Tb, 0.0411 mmol/L 39.8 TC G, 4.68mg/dl (Teslovich >99.9 G, 0.121 mmol/L >99.9 93.9 G, 0.0737 mmol/L >99.9 99.2 G,-0.0388 mmol/L 93.7 >99.9 - - >99.9 G, C3-A1 cluster et al., 2010) LDL-C G, 2.85mg/dl (Teslovich et al., 2010) HDL-C G, -1.5mg/dl (Teslovich et al., 2010) G, -0.17 s.d. units (Kathiresan et al., 2009) TG G, 16.95mg/dl (Teslovich et al., 2010) 0.131(natural log) value Chr.: chromosome. CEU: Utah residents with Northern and Western European ancestry from the CEPH collection. CHB: Han Chinese in Beijing, China. MAF: minor allele frequency. The MAFs of CEU and CHB are from HapMap database (http://hapmap.ncbi.nlm.nih.gov/) >99.9 TG: triglycerides; TC: total cholesterol; HDL-C: high density lipoprotein cholesterol; LDL-C: low density lipoprotein cholesterol. * We referred to the study reported by Tikkanen E., et al. in children, and used the effects from children to calculate the specific power for our children population. The SNP in high linkage disequilibrium (LD) (r2>0.75) with our selected SNPs was cited. Effect sizes for HDL-C, LDL-C, and total cholesterol are in mmol/L and for TG natural log-transformed mmol/L. a The tested SNP is rs4846914, which is in a high LD with rs2144300 (r2=0.878). b The tested SNP is rs3850634, which is in a high LD wi Online Supplementary Table 5 Association of the seven SNPs with TG, TC, HDL-C and LDL-C all a boys b girls b lipid trait SNP minor allele effect p value effect p value effect p value TG * (mg/dl) rs2144300 T -0.03 9.30×10⁻³ -0.03 0.18 -0.04 0.03 rs1260333 C -0.07 6.20×10⁻¹¹ -0.06 2.27×10⁻⁵ -0.07 7.60×10⁻⁷ -11 -0.06 7.16×10 -5 -0.07 2.48×10⁻⁷ TC (mg/dl) rs1260326 C -0.07 8.73×10 rs10105606 A -0.03 0.010 -0.03 0.10 -0.04 0.02 rs2954029 A 0.02 0.030 0.03 0.06 0.02 0.27 rs1748195 G -0.03 0.016 -0.03 0.06 -0.03 0.11 0.08 7.53×10⁻⁷ rs964184 G 0.09 2.33×10 rs2144300 T -0.04 0.97 rs1260333 HDL-C (mg/dl) C -2.17 -13 0.10 3.09×10 -8 -1.99 0.13 2.00 0.16 3.30×10 -3 -2.68 0.008 -1.33 0.21 -3 -2.40 0.019 -1.50 0.16 -1.03 rs1260326 C -2.12 4.39×10 rs10105606 A 0.36 0.71 rs2954029 A 2.58 6.36×10 rs1748195 G -1.24 rs964184 G rs2144300 0.44 1.97 0.16 2.96 0.005 2.21 0.04 0.15 -1.67 0.16 -0.84 0.50 1.83 0.040 2.29 0.06 1.07 0.40 T 0.71 0.042 0.31 0.53 1.02 0.04 rs1260333 C 0.34 0.20 0.08 0.83 0.75 0.04 rs1260326 C 0.41 0.13 0.22 0.57 0.76 0.04 0.95 0.06 1.65 5.74×10⁻⁴ -0.12 0.76 -0.36 0.33 -0.90 0.042 -0.44 0.31 -1.26 0.006 -0.88 0.05 rs10105606 A 1.19 6.66×10 rs2954029 A -0.25 0.36 rs1748195 G -0.67 0.031 rs964184 G -0.97 2.55×10 -4 -4 -3 LDL-C (mg/dl) rs2144300 T -0.37 0.67 -1.53 0.20 0.91 0.49 rs1260333 C -1.60 0.017 -2.30 0.013 -0.72 0.46 rs1260326 C -1.69 0.013 -2.25 0.015 -0.94 0.34 rs10105606 A -0.58 0.51 -2.03 0.10 0.91 0.48 rs2954029 A 2.25 1.09×10⁻³ 2.53 0.008 1.96 0.05 rs1748195 G -0.07 0.93 -0.46 0.67 0.28 0.81 2.77 0.013 1.62 0.17 rs964184 G 2.25 5.51×10 -3 Abbreviations: TG: triglycerides; TC: total cholesterol; HDL-C: high density lipoprotein cholesterol; LDL-C: low density lipoprotein cholesterol. Effects are measured as additive effects, which correspond to the average change in phenotype when the major allele is replaced by the minor allele. * TG levels were natural logarithmically transformed for normal distribution. a p values were calculated with adjustment for age, sex, BMI and puberty stage under the additive model. b p values were calculated with adjustment for age, BMI and puberty stage under the additive model. p values <0.05 are shown in bold. Online Supplementary Table 6 Association of the seven SNPs with TG, TC, HDL-C and LDL-C for obese and non-obese groups. non-obese ** Obese ** lipid trait SNP minor allele effect p value effect p value TG * (mg/dl) rs2144300 T -0.05 0.06 -0.03 0.08 rs1260333 C -0.08 1.16×10⁻⁵ -0.06 1.08×10⁻⁶ rs1260326 C -0.07 1.30×10⁻⁴ -0.07 1.65×10⁻⁷ rs10105606 A -0.03 0.13 -0.03 0.13 rs2954029 A 0.03 0.16 0.02 0.10 rs1748195 G -0.04 0.05 -0.02 0.15 0.09 1.24×10⁻⁸ TC (mg/dl) HDL-C (mg/dl) -5 rs964184 G 0.10 1.54×10 rs2144300 T -2.08 0.19 1.02 0.41 rs1260333 C -2.84 0.016 -1.73 0.06 rs1260326 C -2.27 0.06 -1.95 0.039 rs10105606 A -1.72 0.25 1.67 0.19 rs2954029 A 3.59 0.003 2.01 0.036 rs1748195 G -4.09 0.003 0.18 0.87 rs964184 G 3.45 0.017 0.95 0.40 rs2144300 T 0.56 0.29 0.79 0.09 rs1260333 C 0.31 0.44 0.44 0.22 rs1260326 C 0.37 0.35 0.52 0.15 rs10105606 A 0.43 0.39 1.37 0.005 rs2954029 A 0.54 0.18 -0.66 0.07 rs1748195 G -1.29 0.005 -0.39 0.35 rs964184 G -0.58 0.23 -1.14 0.008 LDL-C (mg/dl) rs2144300 T -2.15 0.13 0.56 0.62 rs1260333 C -2.12 0.045 -1.30 0.13 rs1260326 C -1.80 0.09 -1.60 0.07 rs10105606 A -1.62 0.22 0.29 0.81 rs2954029 A 2.30 0.033 2.18 0.014 rs1748195 G -2.82 0.021 1.33 0.19 rs964184 G 2.67 0.038 1.95 0.06 Abbreviations: TG: triglycerides; TC: total cholesterol; HDL-C: high density lipoprotein cholesterol; LDL-C: low density lipoprotein cholesterol. Effects are measured as additive effects, which correspond to the average change in phenotype when the major allele is replaced by the minor allele. * TG levels were natural logarithmically transformed for normal distribution. ** p values were calculated with adjustment for sex, age and puberty stage under the additive model. p values <0.05 are shown in bold. Online Supplementary Table 7 Association of candidate SNPs in dyslipidemia and nondyslipidemia individuals stratified by non-obese and obese. nondyslipidemia dyslipidemia minor group SNP Chr. gene allele C/C C/R R/R C/C C/R R/R OR(95%CI) p value non-obese rs2144300 1 GALNT2 T 1169 510 63 376 134 17 0.86(0.72-1.04) 0.12 rs1260333 2 GCKR C 533 828 381 179 252 96 0.87(0.76-1.00) 0.047 rs1260326 2 GCKR C 524 846 372 180 253 94 0.85(0.74-0.98) 0.026 rs10105606 8 LPL A 1182 513 47 359 154 14 0.98(0.81-1.18) 0.83 rs2954029 8 TRIB1 A 623 816 303 157 282 88 1.13(0.98-1.30) 0.10 rs1748195 1 ANGPTL3 G 1038 606 98 304 188 35 1.09(0.92-1.28) 0.32 APOA5-A4-C3-A1 obese rs964184 11 cluster G 1053 606 83 283 205 39 1.28(1.09-1.51) 0.003 rs2144300 1 GALNT2 T 521 218 23 329 120 14 0.88(0.70-1.11) 0.27 rs1260333 2 GCKR C 198 384 180 151 224 88 0.76(0.64-0.90) 0.002 rs1260326 2 GCKR C 203 381 178 143 236 84 0.78(0.66-0.93) 0.006 rs10105606 8 LPL A 510 223 29 317 126 20 0.94(0.76-1.17) 0.58 rs2954029 8 TRIB1 A 284 372 106 181 204 78 1.04(0.87-1.24) 0.64 rs1748195 1 ANGPTL3 G 432 289 41 284 144 35 0.92(0.76-1.13) 0.43 G 513 226 23 268 166 29 1.48(1.20-1.82) 2.11×10⁻⁴ APOA5-A4-C3-A1 rs964184 11 cluster Abbreviations: Chr, chromosome. C/C, homozygous for major allele; C/R, heterozygous for minor allele; R/R, homozygous for minor allele. p values with adjusted age, sex, and puberty stage are displayed under the additive model, and p<0.05 are shown in bold. Reference List Kathiresan S, Willer CJ, Peloso GM, Demissie S, Musunuru K, Schadt EE, Kaplan L, Bennett D, Li Y, Tanaka T, Voight BF, Bonnycastle LL, Jackson AU, Crawford G, Surti A, Guiducci C, Burtt NP, Parish S, Clarke R, Zelenika D, Kubalanza KA, Morken MA, Scott LJ, Stringham HM, Galan P, Swift AJ, Kuusisto J, Bergman RN, Sundvall J, Laakso M, Ferrucci L, Scheet P, Sanna S, Uda M, Yang Q, Lunetta KL, Dupuis J, de Bakker PI, O'Donnell CJ, Chambers JC, Kooner JS, Hercberg S, Meneton P, Lakatta EG, Scuteri A, Schlessinger D, Tuomilehto J, Collins FS, Groop L, Altshuler D, Collins R, Lathrop GM, Melander O, Salomaa V, Peltonen L, Orho-Melander M, Ordovas JM, Boehnke M, Abecasis GR, Mohlke KL, Cupples LA (2009) Common variants at 30 loci contribute to polygenic dyslipidemia. Nat Genet 41:56-65 Teslovich TM, Musunuru K, Smith AV, Edmondson AC, Stylianou IM, Koseki M, Pirruccello JP, Ripatti S, Chasman DI, Willer CJ, Johansen CT, Fouchier SW, Isaacs A, Peloso GM, Barbalic M, Ricketts SL, Bis JC, Aulchenko YS, Thorleifsson G, Feitosa MF, Chambers J, Orho-Melander M, Melander O, Johnson T, Li X, Guo X, Li M, Shin CY, Jin GM, Jin KY, Lee JY, Park T, Kim K, Sim X, Twee-Hee OR, Croteau-Chonka DC, Lange LA, Smith JD, Song K, Hua ZJ, Yuan X, Luan J, Lamina C, Ziegler A, Zhang W, Zee RY, Wright AF, Witteman JC, Wilson JF, Willemsen G, Wichmann HE, Whitfield JB, Waterworth DM, Wareham NJ, Waeber G, Vollenweider P, Voight BF, Vitart V, Uitterlinden AG, Uda M, Tuomilehto J, Thompson JR, Tanaka T, Surakka I, Stringham HM, Spector TD, Soranzo N, Smit JH, Sinisalo J, Silander K, Sijbrands EJ, Scuteri A, Scott J, Schlessinger D, Sanna S, Salomaa V, Saharinen J, Sabatti C, Ruokonen A, Rudan I, Rose LM, Roberts R, Rieder M, Psaty BM, Pramstaller PP, Pichler I, Perola M, Penninx BW, Pedersen NL, Pattaro C, Parker AN, Pare G, Oostra BA, O'Donnell CJ, Nieminen MS, Nickerson DA, Montgomery GW, Meitinger T, McPherson R, McCarthy MI, McArdle W, Masson D, Martin NG, Marroni F, Mangino M, Magnusson PK, Lucas G, Luben R, Loos RJ, Lokki ML, Lettre G, Langenberg C, Launer LJ, Lakatta EG, Laaksonen R, Kyvik KO, Kronenberg F, Konig IR, Khaw KT, Kaprio J, Kaplan LM, Johansson A, Jarvelin MR, Janssens AC, Ingelsson E, Igl W, Kees HG, Hottenga JJ, Hofman A, Hicks AA, Hengstenberg C, Heid IM, Hayward C, Havulinna AS, Hastie ND, Harris TB, Haritunians T, Hall AS, Gyllensten U, Guiducci C, Groop LC, Gonzalez E, Gieger C, Freimer NB, Ferrucci L, Erdmann J, Elliott P, Ejebe KG, Doring A, Dominiczak AF, Demissie S, Deloukas P, de Geus EJ, de FU, Crawford G, Collins FS, Chen YD, Caulfield MJ, Campbell H, Burtt NP, Bonnycastle LL, Boomsma DI, Boekholdt SM, Bergman RN, Barroso I, Bandinelli S, Ballantyne CM, Assimes TL, Quertermous T, Altshuler D, Seielstad M, Wong TY, Tai ES, Feranil AB, Kuzawa CW, Adair LS, Taylor HA, Jr., Borecki IB, Gabriel SB, Wilson JG, Holm H, Thorsteinsdottir U, Gudnason V, Krauss RM, Mohlke KL, Ordovas JM, Munroe PB, Kooner JS, Tall AR, Hegele RA, Kastelein JJ, Schadt EE, Rotter JI, Boerwinkle E, Strachan DP, Mooser V, Stefansson K, Reilly MP, Samani NJ, Schunkert H, Cupples LA, Sandhu MS, Ridker PM, Rader DJ, van Duijn CM, Peltonen L, Abecasis GR, Boehnke M, Kathiresan S (2010) Biological, clinical and population relevance of 95 loci for blood lipids. Nature 466:707-713 Tikkanen E, Tuovinen T, Widen E, Lehtimaki T, Viikari J, Kahonen M, Peltonen L, Raitakari OT, Ripatti S (2011) Association of known loci with lipid levels among children and prediction of dyslipidemia in adults. Circ Cardiovasc Genet 4:673-680 Waterworth DM, Ricketts SL, Song K, Chen L, Zhao JH, Ripatti S, Aulchenko YS, Zhang W, Yuan X, Lim N, Luan J, Ashford S, Wheeler E, Young EH, Hadley D, Thompson JR, Braund PS, Johnson T, Struchalin M, Surakka I, Luben R, Khaw KT, Rodwell SA, Loos RJ, Boekholdt SM, Inouye M, Deloukas P, Elliott P, Schlessinger D, Sanna S, Scuteri A, Jackson A, Mohlke KL, Tuomilehto J, Roberts R, Stewart A, Kesaniemi YA, Mahley RW, Grundy SM, McArdle W, Cardon L, Waeber G, Vollenweider P, Chambers JC, Boehnke M, Abecasis GR, Salomaa V, Jarvelin MR, Ruokonen A, Barroso I, Epstein SE, Hakonarson HH, Rader DJ, Reilly MP, Witteman JC, Hall AS, Samani NJ, Strachan DP, Barter P, van Duijn CM, Kooner JS, Peltonen L, Wareham NJ, McPherson R, Mooser V, Sandhu MS (2010) Genetic variants influencing circulating lipid levels and risk of coronary artery disease. Arterioscler Thromb Vasc Biol 30:2264-2276 Willer CJ, Sanna S, Jackson AU, Scuteri A, Bonnycastle LL, Clarke R, Heath SC, Timpson NJ, Najjar SS, Stringham HM, Strait J, Duren WL, Maschio A, Busonero F, Mulas A, Albai G, Swift AJ, Morken MA, Narisu N, Bennett D, Parish S, Shen H, Galan P, Meneton P, Hercberg S, Zelenika D, Chen WM, Li Y, Scott LJ, Scheet PA, Sundvall J, Watanabe RM, Nagaraja R, Ebrahim S, Lawlor DA, Ben-Shlomo Y, vey-Smith G, Shuldiner AR, Collins R, Bergman RN, Uda M, Tuomilehto J, Cao A, Collins FS, Lakatta E, Lathrop GM, Boehnke M, Schlessinger D, Mohlke KL, Abecasis GR (2008) Newly identified loci that influence lipid concentrations and risk of coronary artery disease. Nat Genet 40:161-169


