advertisement
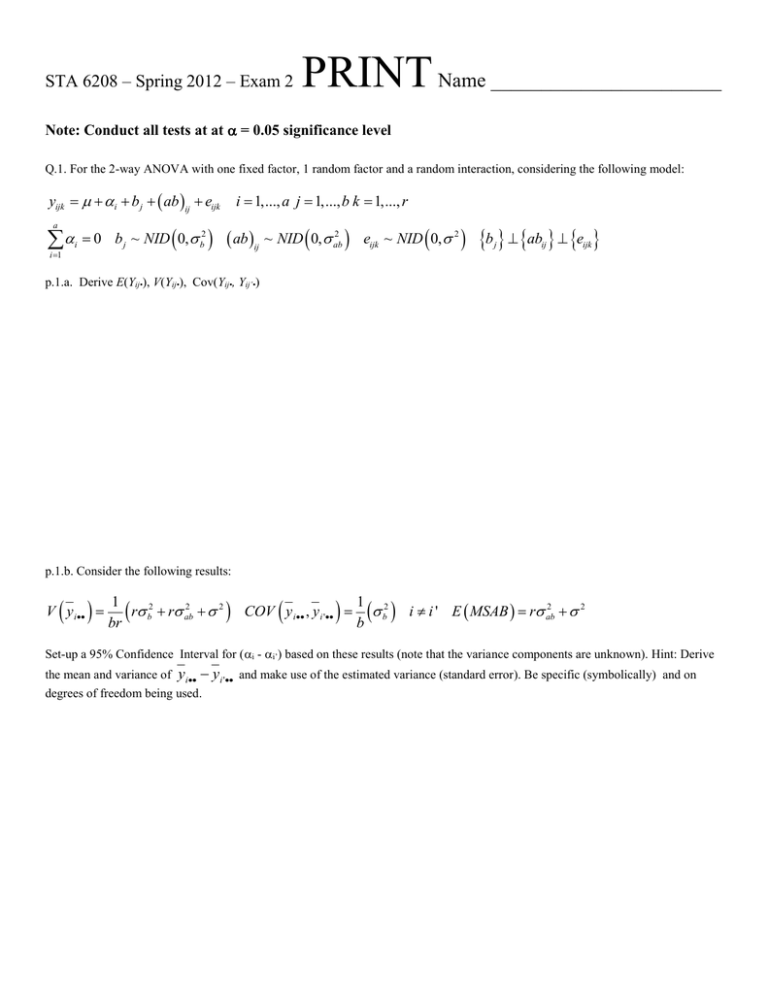
STA 6208 – Spring 2012 – Exam 2 PRINT Name _______________________ Note: Conduct all tests at at = 0.05 significance level Q.1. For the 2-way ANOVA with one fixed factor, 1 random factor and a random interaction, considering the following model: yijk i b j ab ij eijk a i 1 i 0 b j ~ NID 0, b2 i 1,..., a j 1,..., b k 1,..., r ab ij 2 ~ NID 0, ab eijk ~ NID 0, 2 b ab e j ij ijk p.1.a. Derive E(Yij•), V(Yij•), Cov(Yij•, Yij’•) p.1.b. Consider the following results: V y i 1 2 r b2 r ab 2 br COV y i , y i ' 1 2 b b 2 i i ' E MSAB r ab 2 Set-up a 95% Confidence Interval for (i - i’) based on these results (note that the variance components are unknown). Hint: Derive the mean and variance of yi yi ' and make use of the estimated variance (standard error). Be specific (symbolically) and on degrees of freedom being used. Q.2. A 2-Factor (nested, fixed effects ANOVA) is fit, with factor A at 4 levels, and factor B at 3 levels (within each level of A). There were 6 replicates for each combination of factor levels. Compute Bonferroni’s and Tukey’s minimum significant differences for comparing all pairs of means (Factor A) with an experiment-wise error rate of 0.05. Note: This is the same as the margin of error for the point estimates (half-width of simultaneous CI’s). Give your results as functions of only MSE. The model is: yijk i j (i ) ek (ij ) 4 i 0 i 1 3 j 1 j (i ) i 1, 2,3, 4 j 1, 2,3 k 1,..., 6 0 i ek (ij ) ~ NID 0, 2 Bonferroni _______________________________________ Tukey _____________________________________________ Q.3. The following partial ANOVA table gives the results of a balanced 2-Way ANOVA with interaction. Fill in the following values (for the mixed model, assume the unrestricted model, that is (ab)ij ~ NID(0,ab2)): Source A B AB Error Total df 2 4 SS 600 820 256 75 2126 a ___ b ___ r ___ FAB ______ A Fixed, B Fixed: FA _____ F (.05) _____ _____ F (.05) _____ A Random, B Random: FA _____ A Fixed, B Random: FA _____ ^ 2 FB _____ F (.05) _____ F (.05) _____ FB _____ F (.05) _____ FB _____ F (.05) _____ F (.05) _____ Q.4. Consider the 1-Way Random Effects Model: yij ai eij i 1,..., t j 1,..., r ai ~ NID 0, a2 eij ~ NID 0, e2 a e p.4.a. Based on rules involving linear functions of RVs, derive the following values: E yij , V yij , V yi , V y , COV yij , yi p.4.b. In a population of individuals, 95% have mean values between 80 and 120. I, the Intraclass Correlation is 0.80. Within individuals, 95% of individual observations lie within how many units from the individual mean? Q.5. For the 2-Way ANOVA with random effects and interactions, yijk ai b j ab ij eijk i 1,..., a; j 1,..., b; k 1,..., r ai ~ NID 0, a2 b j ~ NID 0, b2 ab ij ~ NID 0, ab2 eijk ~ N 0, 2 a b ab e Obtain the following quantities: p.5.a. E yijk p.5.b. COV yijk , yi ' j ' k ' p.5.c. V y ij i i ', j j ', k k ' i i ', j j ', k k ' i i ', j j ', k , k ' i i ', j j ', k , k ' i i ', j j ', k , k ' Q.6. In a large factory, with many Operators, Parts, and Devices, an experiment is conducted to measure the variation in measured strengths of parts. Samples of 6 Operators, 8 Parts, and 4 Devices were obtained; with each combination of Operators, Parts, and Instruments being replicated 3 times. The following model is fit (with all random effects independent). yijkl oi p j d k opij odik pd jk opdijk eijkl opij ~ N 0, op2 odik ~ N 0, od2 oi ~ N 0, o2 p j ~ N 0, p2 d k ~ N 0, d2 2 pd jk ~ N 0, pd opdijk ~ N 0, opd2 eijkl ~ N 0, 2 p.6.a. Complete the following ANOVA Table: Source O P D OP OD PD OPD Error Total df SS 800 490 420 700 240 105 315 2 opd 0 vs HA: op2 0 vs HA: o2 0 vs HA: op2 op2 0 p.6.d.i Obtain an unbiased estimate of p.6.d.ii. Test H0: 2 opd _________________________ 2 opd 0 p.6.c.i Obtain an unbiased estimate of p.6.c.ii. Test H0: E(MS) 4030 p.6.b.i Obtain an unbiased estimate of p.6.b.ii. Test H0: MS o2 o2 0 Test Statistic: _____________ Rejection Region: ___________ _________________________ Test Statistic: _____________ Rejection Region: ___________ _________________________ Test Statistic: _____________ Rejection Region: ___________ 2 c gi MSi c ^ "Synthetic Mean Square" = gi MSi * i 1 2 c i 1 gi MSi i 1 i where i df MSi Q.7. A study is conducted to compare 3 methods of teaching speed reading to adults. A sample of 9 adults (with no prior exposure to speed-reading techniques) is taken, and randomly assigned so that 3 adults receive method 1, 3 receive method 2, and 3 receive method 3. Each adult is observed reading 4 texts of the same length, and y, the amount of time needed to complete the text is measured. The model fit is: yij i b j (i ) ek (ij ) a i 1 i i 1,..., a j 1,..., b k 1,..., r 0 b j (i ) ~ NID 0, B2 ( A) ek (ij ) ~ NID 0, 2 b e The means (SDs) for each adult are given below (in minutes). Method Adult Mean (SD) 1 1 120 (10) 1 2 125 (12) 1 3 115 (8) 2 4 105 (12) 2 5 110 (10) 2 6 115 (8) 3 7 135 (10) 3 8 130 (12) 3 9 125 (8) Complete the following ANOVA table. Source Method Adult(Method) Error Total df SS MS F F(0.05)
