Spring 2010 - Exam 3 (No Solutions Will be posted)
advertisement
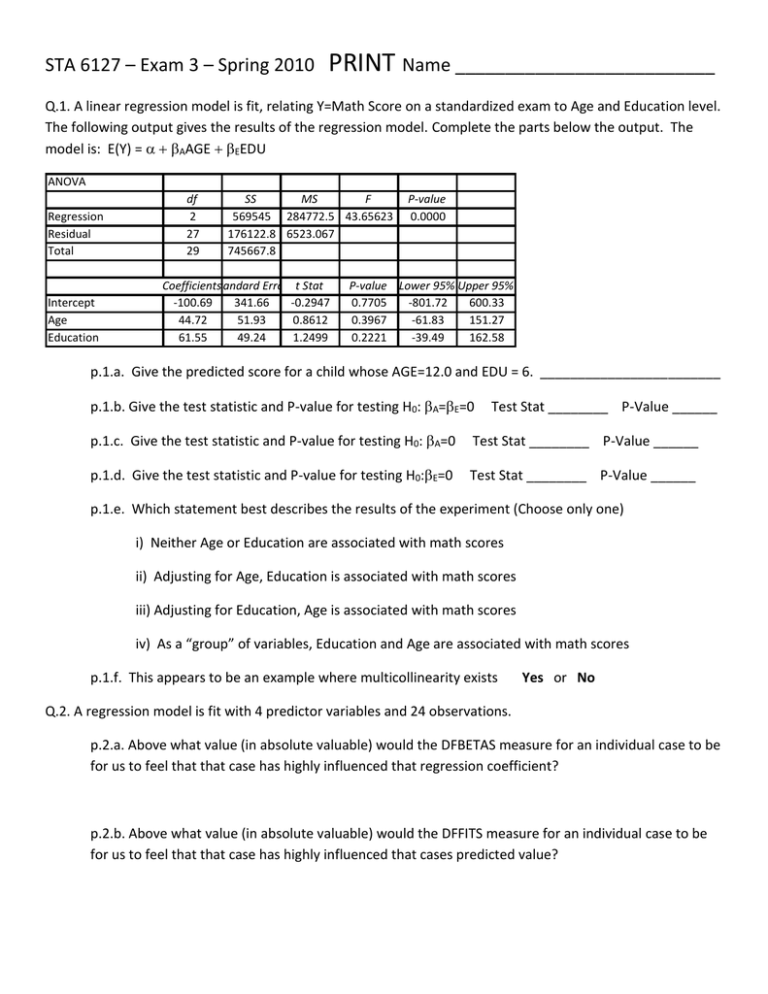
STA 6127 – Exam 3 – Spring 2010 PRINT Name __________________________ Q.1. A linear regression model is fit, relating Y=Math Score on a standardized exam to Age and Education level. The following output gives the results of the regression model. Complete the parts below the output. The model is: E(Y) = AAGEEEDU ANOVA Regression Residual Total Intercept Age Education df 2 27 29 SS MS F 569545 284772.5 43.65623 176122.8 6523.067 745667.8 Coefficients Standard Error t Stat -100.69 341.66 -0.2947 44.72 51.93 0.8612 61.55 49.24 1.2499 P-value 0.0000 P-value Lower 95% Upper 95% 0.7705 -801.72 600.33 0.3967 -61.83 151.27 0.2221 -39.49 162.58 p.1.a. Give the predicted score for a child whose AGE=12.0 and EDU = 6. ________________________ p.1.b. Give the test statistic and P-value for testing H0: A=E=0 Test Stat ________ P-Value ______ p.1.c. Give the test statistic and P-value for testing H0: A=0 Test Stat ________ P-Value ______ p.1.d. Give the test statistic and P-value for testing H0:E=0 Test Stat ________ P-Value ______ p.1.e. Which statement best describes the results of the experiment (Choose only one) i) Neither Age or Education are associated with math scores ii) Adjusting for Age, Education is associated with math scores iii) Adjusting for Education, Age is associated with math scores iv) As a “group” of variables, Education and Age are associated with math scores p.1.f. This appears to be an example where multicollinearity exists Yes or No Q.2. A regression model is fit with 4 predictor variables and 24 observations. p.2.a. Above what value (in absolute valuable) would the DFBETAS measure for an individual case to be for us to feel that that case has highly influenced that regression coefficient? p.2.b. Above what value (in absolute valuable) would the DFFITS measure for an individual case to be for us to feel that that case has highly influenced that cases predicted value? Q.3. A logistic regression model is fit, relating whether a coupon is redeemed (Y=1, if yes, 0 if not) to the Value of the coupon (V=$5, $10, $15, $20) for a product with a base price of $75. The estimated regression coefficients and statistics are given below for the model: log(odds(redeem)) = V Variable Value Constant B 0.152 -4.082 SE 0.032 0.529 Wald 22.336 59.492 df 1 1 Sig 0.000 0.000 Exp(B) 1.164 0.017 p.3.a. Give the (Wald) Test statistic, Rejection Region, and P-value for testing H0: = 0 vs HA: ≠0. Test Statistic ____________ Rejection Region _____________ P-value _______________ p.3.b. Give the fitted probabilities for a coupon to be redeemed when the Value is $5 and when $20: ^ 5 ^ 20 Q.4. Two regression models were fit, relating advertising price for newspaper ads (Y in $) to circulation (X in 10000s). The authors fit a linear regression and quadratic regression relating Y to X, based on n=160 papers. Test H0: The relationship is linear ( vs HA: The relation is nonlinear (≠at the = 0.05 significance level. For the model: E(Y) = 1 X X2 ^ Y Linear 7.25 5 X 2 RLinear 0.9274 ^ Y Quad 4.03 7 X 0.03 X 2 p.4.1.: Test Statistic: p.4.b. Rejection Region: Test Statistic > or < ____________________ p.4.c. Do you conclude that the relationship is not linear? Yes or No 2 RLinear 0.9369 Q.5. A survey measured Chinese residents willingness to engage in rightful resistance to local authorities (Y=1 if Yes, 0 if No). The independent variables were: Age, Male(yes=1,no=0), Education, Annual Household Income, Party Member (yes=1,no=0), PLA Vet (yes=1,no=0), More Trust in high levels of government than low levels (interval scale) For the null model: log(odds(Y=1)) = , -2logL = 619.77. For the full model: log(odds(Y=1)) = Age + … + 7 TrustHigh, -2logL = 523.89 Variable Intercept Age Male Educ HHInc Party PLA Vet HighTrust B -3.72 0.05 0.59 0.05 0.02 0.45 1.02 0.18 SE 0.56 0.09 0.3 0.05 0.07 0.36 0.42 0.1 Wald X2 44.13 0.31 3.87 1.00 0.08 1.56 5.90 3.24 Exp(B) 0.02 1.05 1.80 1.05 1.02 1.57 2.77 1.20 p.5.a. Test H0: versus HA: Not all i = 0 Test Statistic ______________ Rejection Region ______________ P-Value < or > 0.05 p.5.b. Controlling all other factors, the odds of a male engaging in rightful resistance is ________ times the odds of a female engaging in rightful resistance p.5.c. If you ran backward elimination with SLS=0.05, which factor would be the first to be eliminated? Hint: Compare the smallest (B/SE)2 with the critical chi-square value with 1 degree of freedom. Factor eliminated ___________________ because ________ < or > ________________ Q.6. An ordinal regression model is fit, relating a quality relating of beer (Y=Good (3),Fair(2),Poor(1)) to the price the rater was told it cost (X=$2,$3,$4). Note, in reality it was always the same beer. A model is fit, where: log odds(Y j ) j X j 1,2 Goodness-of-Fit Chi-Square df Sig. Pearson 1.294 3 .731 Deviance 1.291 3 .731 Link function: Logit. Parameter Estimates 95% Confidence Interval Estimate Std. Error Wald df Sig. Lower Bound Upper Bound Threshold [quality = 1.00000] .076 [quality = 2.00000] .043 1 .836 -.646 .798 1.794 .395 20.655 1 .000 1.021 2.568 .418 .171 5.953 1 .015 .082 .754 Location price .368 Link function: Logit. p.6.a. Complete the following table of fitted Probabilities: Fitted P(Poor) P(Fair) P(Good) Price=2 0.319 0.404 0.277 Price=3 0.235 0.396 0.368 Price=4 0.169 p.6.b. The Pearson Goodness-of-fit statistic for this model, compared to the saturated model which fits 6 distinct logits to the first 2 rows of the above table (and perfectly fits the sample data) is equal to 1.294 which under the null hypothesis that our regression model is appropriate has a P-value of 0.731 (based on chi-square distribution with 3 df (6 logits – 3 Parameters in our model). Do you feel our model is appropriate? Yes or No


