Exam 2 - Fall 2008
advertisement
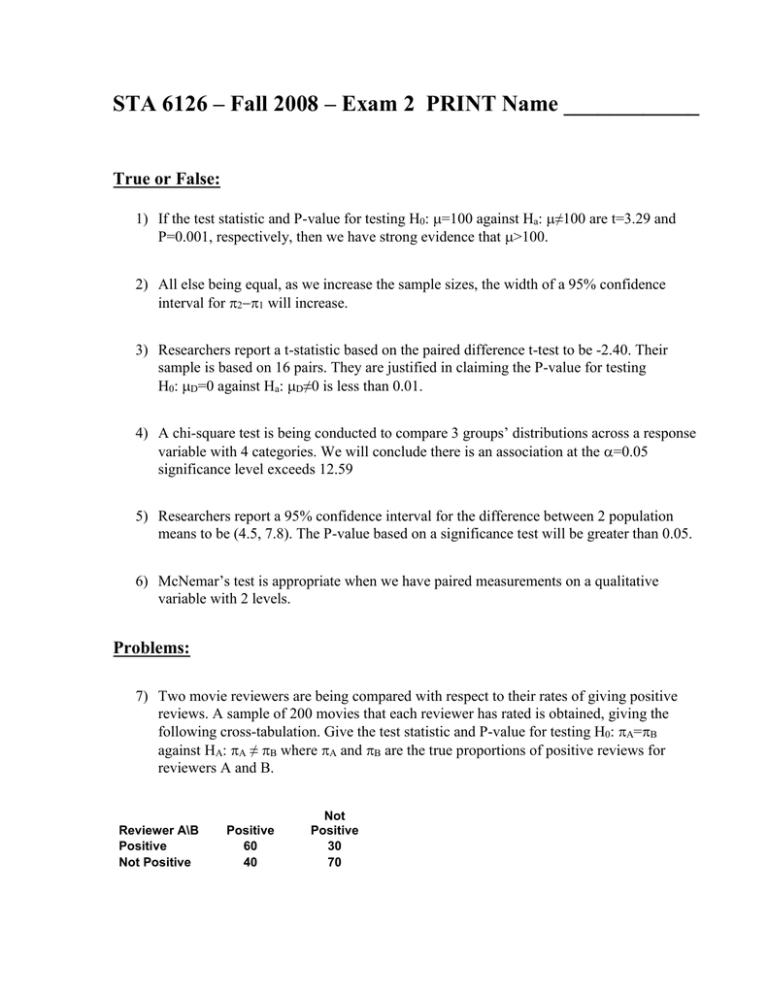
STA 6126 – Fall 2008 – Exam 2 PRINT Name ____________ True or False: 1) If the test statistic and P-value for testing H0: =100 against Ha: ≠100 are t=3.29 and P=0.001, respectively, then we have strong evidence that >100. 2) All else being equal, as we increase the sample sizes, the width of a 95% confidence interval for will increase. 3) Researchers report a t-statistic based on the paired difference t-test to be -2.40. Their sample is based on 16 pairs. They are justified in claiming the P-value for testing H0: D=0 against Ha: D≠0 is less than 0.01. 4) A chi-square test is being conducted to compare 3 groups’ distributions across a response variable with 4 categories. We will conclude there is an association at the =0.05 significance level exceeds 12.59 5) Researchers report a 95% confidence interval for the difference between 2 population means to be (4.5, 7.8). The P-value based on a significance test will be greater than 0.05. 6) McNemar’s test is appropriate when we have paired measurements on a qualitative variable with 2 levels. Problems: 7) Two movie reviewers are being compared with respect to their rates of giving positive reviews. A sample of 200 movies that each reviewer has rated is obtained, giving the following cross-tabulation. Give the test statistic and P-value for testing H0: A=B against HA: A ≠ B where A and B are the true proportions of positive reviews for reviewers A and B. Reviewer A\B Positive Not Positive Positive 60 40 Not Positive 30 70 8) A study is conducted to determine whether there is an effect of a new pricing policy on the average number of visitors to a state park. The wildlife officer randomly sampled 12 days prior to the price increase, and 12 days after the price increase and determined the number of visitors from the “sign-in sheets.” She computes the following statistics from the records (she finds no evidence against the variances being equal for the 2 periods). y Before 370 y After 350 s p 1 1 15.0 12 12 a) Obtain a 95% confidence interval for the population mean difference between the 2 time periods (Before - After) b) Based on your confidence interval, would the P-value for testing H0: Before - After =0 Against Ha: Before - After ≠ 0 be Larger or Smaller than 0.05? 9) A content analysis was conducted to compare the reporting of 3 news organizations. Random samples of 50 stories were obtained from each organization, and each was classified by their attitude toward the current government: Positive, Neutral, or Negative. The table of observed frequencies is given below. fo A B C Total Positive 30 10 10 50 Neutral 10 30 10 50 Negative 10 10 30 50 Total 50 50 50 150 a) Obtain the expected count for each cell under the null hypothesis of no association between news organization and attitude toward the current government. Hint: It is the same for each of the 9 cells. b) The chi-square statistic is Xobs2 = 16. Can we conclude that there is an association between news organization and attitude toward the current government at the 0.05 level? Why? 10) A study was conducted to measure the effect of a new training program for new employees at a large company. A sample of 16 new employees were selected and given a test regarding ethics in the workplace before and after a 1-day training session on ethics was given. For each employee, the difference between the scores (After – Before) was obtained. The mean and standard deviation of these differences were 12.0 and 6.0, respectively. Test to determine whether the training course is effective in increasing true mean scores: a) Null Hypothesis: D 0 Alternative Hypothesis: D 0 b) Test Statistic: c) Rejection Region: d) Do we conclude that the training course is effective in increasing true mean scores at the =0.05 significance level? Yes or No 11) A researcher wishes to test whether the recidivism (re-arrest) rate for juveniles from low income households exceeds 50% (0.5). The test statistic for testing H0: = 0.5 against Ha: > 0.5 is zobs = 2.36 based on a large sample of such youths. Report the P-value for this test.


