Texas Hold 'em Estimated and True Winning Probability Worksheet
advertisement
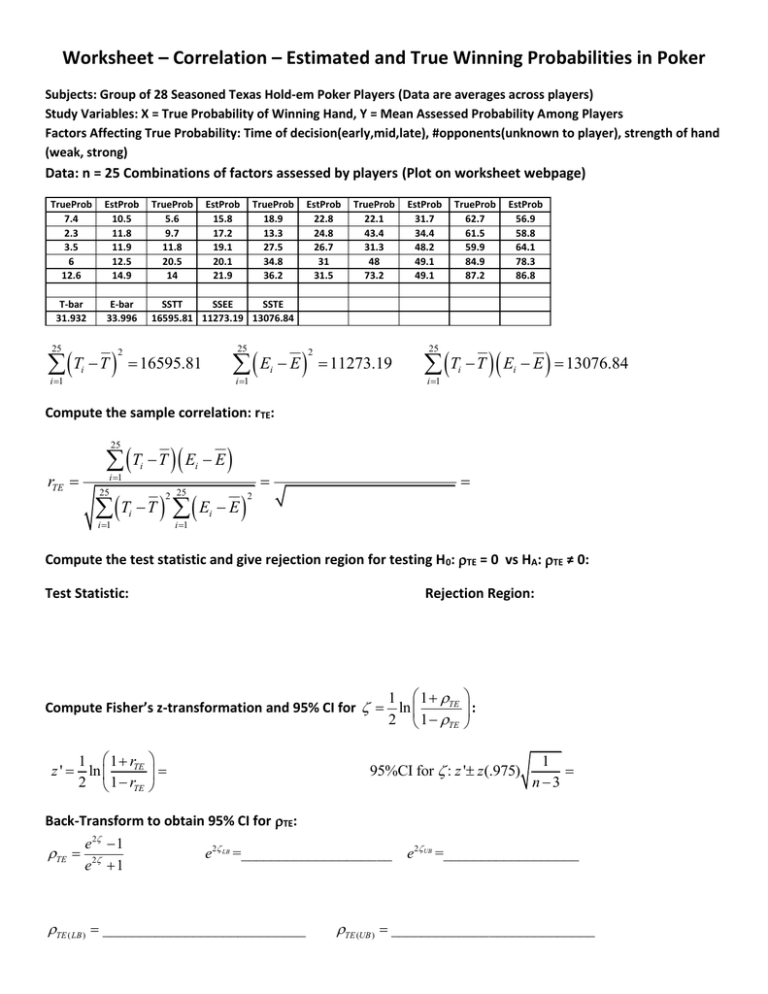
Worksheet – Correlation – Estimated and True Winning Probabilities in Poker Subjects: Group of 28 Seasoned Texas Hold-em Poker Players (Data are averages across players) Study Variables: X = True Probability of Winning Hand, Y = Mean Assessed Probability Among Players Factors Affecting True Probability: Time of decision(early,mid,late), #opponents(unknown to player), strength of hand (weak, strong) Data: n = 25 Combinations of factors assessed by players (Plot on worksheet webpage) TrueProb 7.4 2.3 3.5 6 12.6 EstProb 10.5 11.8 11.9 12.5 14.9 TrueProb 5.6 9.7 11.8 20.5 14 T-bar 31.932 E-bar 33.996 SSTT SSEE SSTE 16595.81 11273.19 13076.84 25 i 1 Ti T 2 EstProb 15.8 17.2 19.1 20.1 21.9 TrueProb 18.9 13.3 27.5 34.8 36.2 25 16595.81 i 1 Ei E EstProb 22.8 24.8 26.7 31 31.5 2 TrueProb 22.1 43.4 31.3 48 73.2 11273.19 EstProb 31.7 34.4 48.2 49.1 49.1 TrueProb 62.7 61.5 59.9 84.9 87.2 EstProb 56.9 58.8 64.1 78.3 86.8 T T E E 13076.84 25 i 1 i i Compute the sample correlation: rTE: T T E E 25 rTE i i 1 i T T E E 25 i 1 2 25 i i 1 2 i Compute the test statistic and give rejection region for testing H 0: TE = 0 vs HA: TE ≠ 0: Test Statistic: Rejection Region: Compute Fisher’s z-transformation and 95% CI for 1 1 rTE z ' ln 2 1 rTE 1 1 TE ln : 2 1 TE 95%CI for : z ' z (.975) 1 n 3 Back-Transform to obtain 95% CI for TE: TE e 2 1 2 e 1 e 2 LB =____________________ TE ( LB ) ___________________________ e 2 UB =__________________ TE (UB ) ___________________________
