Supplemental Information
advertisement

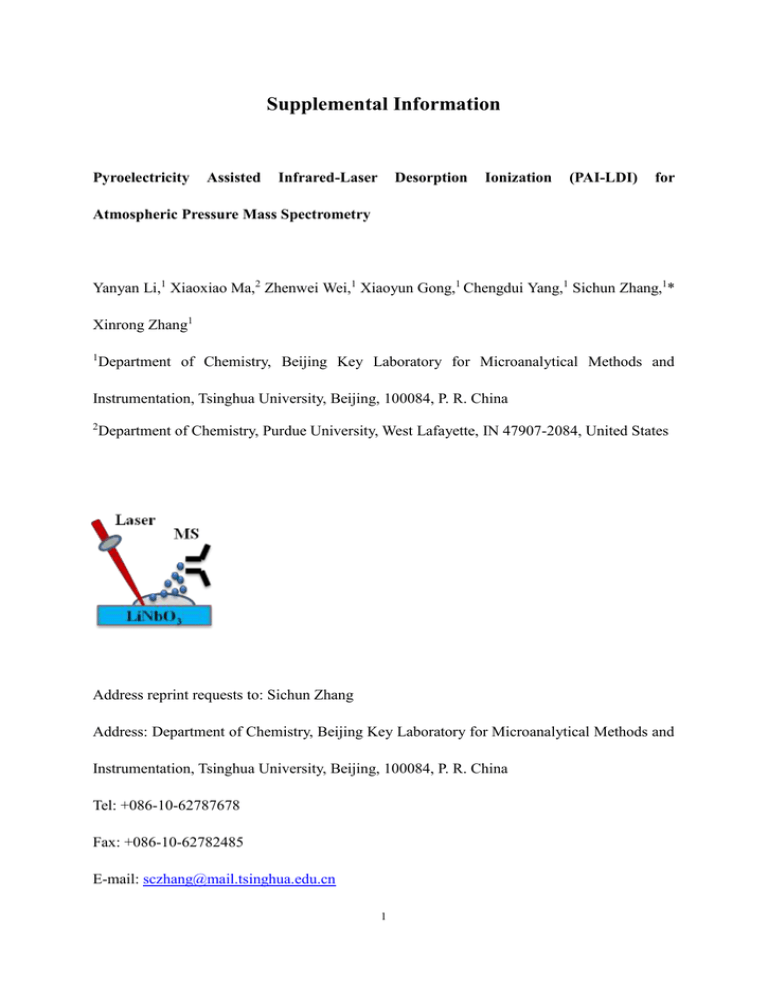
Supplemental Information Pyroelectricity Assisted Infrared-Laser Desorption Ionization (PAI-LDI) for Atmospheric Pressure Mass Spectrometry Yanyan Li,1 Xiaoxiao Ma,2 Zhenwei Wei,1 Xiaoyun Gong,1 Chengdui Yang,1 Sichun Zhang,1* Xinrong Zhang1 1 Department of Chemistry, Beijing Key Laboratory for Microanalytical Methods and Instrumentation, Tsinghua University, Beijing, 100084, P. R. China 2 Department of Chemistry, Purdue University, West Lafayette, IN 47907-2084, United States Address reprint requests to: Sichun Zhang Address: Department of Chemistry, Beijing Key Laboratory for Microanalytical Methods and Instrumentation, Tsinghua University, Beijing, 100084, P. R. China Tel: +086-10-62787678 Fax: +086-10-62782485 E-mail: sczhang@mail.tsinghua.edu.cn 1 Supplemental Information 1. Information of Materials and Chemicals. Table S1. Standard Compounds Information for method establishment Mark Sample Number name S1 1-Acetamidoadaman tane Molecula Structure r weight formula 193.29 CAS number 880-524 Compoun d type Amide S2 Acetanilide 135.16 103-844 Amide S3 2-Aminopyrimidine 95.10 109-126 Amine S4 1-Adamantylamine 151.25 768-945 Amine S5 Spermine 202.34 71-44-3 Aliphatic Diamine S6 2-Aminobenzamide 136.15 88-68-6 Aromatic Amide 2 Table S2. Saccharide Substances Information Mark number S7 Sample name S8 D-(+)-Maltose·H2O 360.31 69-79-4 S9 Maltotriose 1109-28-0 D-(+)-Glucose Molecular weight 180.16 Structure formula CAS number 50-99-7 504.44 Table S3. Substrates Material Information Category Substrate Dimensions (L×W×H) Functional Materials Lithium Niobate (LiNbO3) 15.0 mm×15.0 mm×0.5 mm Metal Copper (Cu) 15.0 mm×15.0 mm×0.2 mm Organic Materials Quantitative Filter Paper ([C6H10O5]n) 15.0 mm×15.0 mm×0.05 mm Inorganic Salt Microslide (Borosilicate Glass) 25.4 mm×76.2 mm×1.0 mm Table S4. Property about Lithium Niobate (LiNbO3) (Reference: PubChem and Ref 13 in manuscript) Property Parameter value Property Parameter value Molecular LiNbO3 Functional Pyroelectricity, performance Piezoelectricity etc. PubChem 159404 Molecular weight 147.8456g/mol Pyroelectric coefficient 70μC/(m2 K) Crystal orientation z-cut Crystal Fine grinding Melting point 1255±5℃ Curie temerature 1140±5℃ Density 4.644g/cm3 @20℃ Thermal conducitivity Moh’s hardness ~5 formula CAS number 12031-63-9 4.0W/m/K@25℃ Refractive indices@1064nmno=2.232 3 2. Complement for Mass Spectra Figure S1.Mass spectra of mixed compounds obtained on different substrates The mixed solution included three compounds: 2-aminopyrimidine ([M+H]+, 96.1), 1-acetamidoadamantane ([M+H]+, 194.3) and acetanilide ([M+H]+, 136.2). Figure S2.PAI-LDI Mass spectra of standard saccharide substances on LiNbO3substrate a, D-(+)-Glucose; b, D-(+)-Maltose·H2O; c, Maltotriose. The mass spectra were used to assist in components identification of Onion juice. 4 Figures S3. The mass spectrum of urine sample showing the whole mass range including spiked 1-adamantylamine and urine native creatinine Figures S4. The mass spectra of analyte using different pyroelectric material as the substrate of PAI-LDI 3. The explanation of parameters selection for the ion source. The distance between the sample spot center and MS inlet have been optimized. The distance of ~10mm, 8mm, 6mm were respectively examined in preliminary experiments. We found that ~6mm was the most appropriate distance. Higher than ~6mm causes the decrease on the MS signals. Lower than ~6mm was not examined because there was no enough free space for laser focus adjustment, due to our instrumental structure limitation. Therefore ~6mm was selected as the distance from sample spot center to MS inlet in following experiments. Laser wavelength was 1064 nm, which is commercial available with fixed single wavelength. The laser frequency was also commercial available equipped with four variable values including 10Hz, 20Hz, 30Hz, 40Hz, which were respectively examined in our preliminary experiments. We found that 20Hz was the most appropriate frequency. Higher or 5 lower than 20Hz would cause decrease on the MS signals, especially, higher than 20Hz would seriously damage pyroelectric substrate. The ~45° incidence angle to the distal end of MS orifice was selected to maximize introduction of ions into MS orifice as well, which is consistent with existing studies [1,2]. The distance from laser facula to sample spot center was about 2mm. We examined the effect of incident angle on MS response. The incident angle of 45 degree was used in this study, although the critical angel at the air/LiNbO3 interface is 27 degrees, as a result there should be laser energy loss due to reflection if a 45 degrees angle was used. However, currently consideration, based on our equipment conditions, there was a little difficult for laser device to combine with MS orifice at 27 degrees. According to our experiments results, 45 degrees gives acceptable desorption/ionization efficiency and detection sensitivity. At the same time, negative pressure near the MS orifice region plays a role to facilitate transfer of analyte ions into MS, which would make the analysis insensitive to the incident angle of the laser. The distance from laser incidence to analyte spot center was within ~2 mm, which was selected to make sure that analyte was efficiently desorbed and more ions were transferred to MS orifice. The radius of sample spot was ~2 mm, when the laser incidence was located to the periphery of the sample spot, thus from laser facula to sample spot center was ~2 mm. However, the laser radiation hit the sample spot. Probably due to the coffee-ring effect [3], in the preliminary experiments, we found that the MS signals of analytes were relatively higher when the laser incidence was directed to the periphery of the sample spot than to the center of sample spot. To accurately quantify, multiple points of the sample spot would be radiated by laser and the MS signals were taken average. For imaging, experiment manipulation was scanning the whole sample spot, thus, the image result would not be affected by the distance between laser incidence and sample spot center. 4. Table S5. Comparing PAI-LDI to other IR-LDI methods IR-LDI IR-laser wavelength Extra Main analyte ionizationassisted setup PAI-LDI 1064nm No LAESI 2.94μm ESI ion source Reserpine, Verapamil Amine,amide, oligosaccharides 6 Concentration/ or LOD Volume of sample ~132fmol or (estimated LOD) 27fmol 25fmol 8fmol 1.5-2μL 5μL IR-LADESI 2.94μm ESI ion source Bovine cytochrome c, Ibuprofen Acetaminophen ESI ion source bovine ubiquitin, or high voltage bovine myoglobin ESI ion source Myoglobin Human blood Ink molecule DART ion Dyestuff molecules source 2nmol 2×10⁻⁵M 20mg/mL ~100μM IR-LDESI 10.6μm LIAD-ESI 1064nm PAMLDI-MS 1064nm HALDI-MS 1064nm High voltage AP-IR-MALDI[4] 2.94μm Matrix and high voltage Peptide,ODN, Ibuprofen Lipid 1-3μL 30mg/mL-1 10μM 25μM 10-5M 1μL 10μL 6mg/mL 100μL 5. LOD estimation based on the PAI-LDI response to 1-adamanylamine 1-adamantylamine (Amantadine) was successfully detected based on PAI-LDI-MS at as low as 20pg (132.2fmol) (see figure 4a), where the S/N ratio was ~15, which was much higher than value of three. Considering the LOD defined as 3×standard deviation of the blank (approximately corresponding to S/N ratio of ~3). Therefore we estimate the LOD based on PAI-LDI response to 1-adamantylamine was ~4pg (26.4fmol), which is corresponding to other laser desorption/post-ionization techniques at same order of magnitude. References: 1. Zhang, J., Li, Z., Zhang, C., Feng, B., Zhou, Z., Bai, Y., Liu, H.: Graphite-coated paper as substrate for high sensitivity analysis in ambient surface-assisted laser desorption/ionization mass spectrometry. Anal Chem. 84, 3296-3301 (2012) 2. Ren, X., Liu, J., Zhang, C., Luo, H.: Direct analysis of samples under ambient condition by high-voltage-assisted laser desorption ionization mass spectrometry in both positive and negative ion mode. Rapid Commun Mass Spectrom. 27, 613-620 (2013) 3. Hu, J. B., Chen, Y. C., Urban, P. L.: Coffee-ring effects in laser desorption/ionization mass spectrometry. Analytica Chimica Acta. 766, 77-82 (2013) 4. Shrestha, B., Nemes, P., Nazarian, J., Hathout, Y., Hoffman, E. P., Vertes, A.: Direct analysis of lipids and small metabolites in mouse brain tissue by AP IR-MALDI and reactive LAESI mass spectrometry. The Analyst. 135, 751 (2010) 7


