150 Lab Write-up Guidelines
advertisement

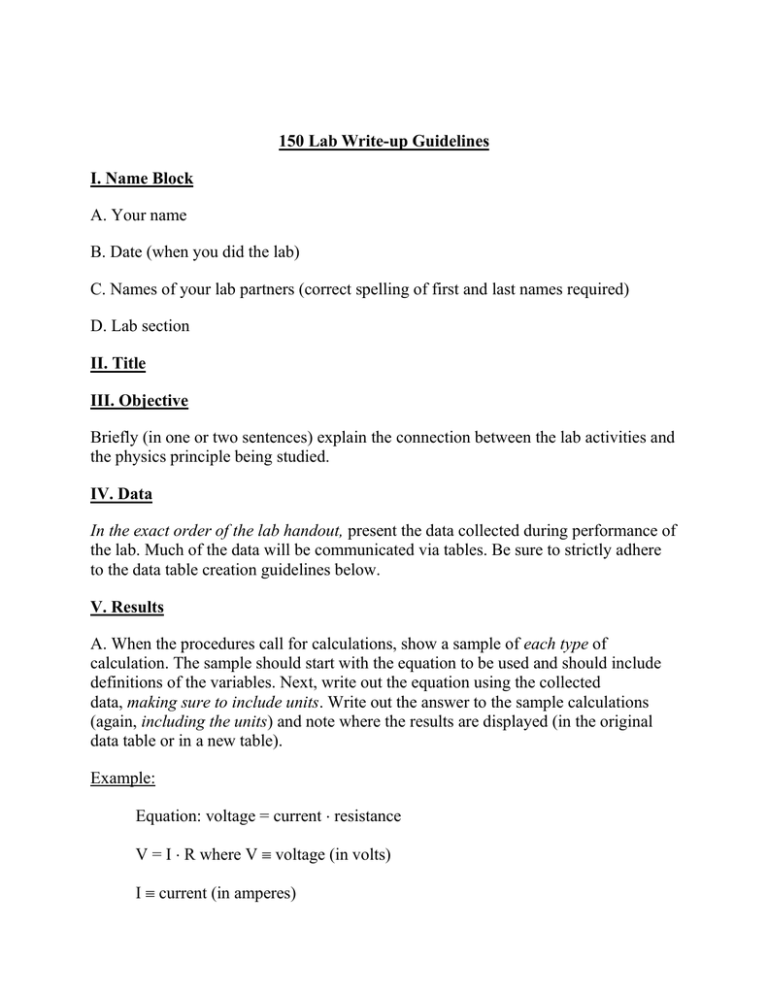
150 Lab Write-up Guidelines I. Name Block A. Your name B. Date (when you did the lab) C. Names of your lab partners (correct spelling of first and last names required) D. Lab section II. Title III. Objective Briefly (in one or two sentences) explain the connection between the lab activities and the physics principle being studied. IV. Data In the exact order of the lab handout, present the data collected during performance of the lab. Much of the data will be communicated via tables. Be sure to strictly adhere to the data table creation guidelines below. V. Results A. When the procedures call for calculations, show a sample of each type of calculation. The sample should start with the equation to be used and should include definitions of the variables. Next, write out the equation using the collected data, making sure to include units. Write out the answer to the sample calculations (again, including the units) and note where the results are displayed (in the original data table or in a new table). Example: Equation: voltage = current resistance V = I R where V voltage (in volts) I current (in amperes) R resistance (in ohms) Data point #1: I = 0.063 A R = 18.1 ohms V = (0.063 A)(18.1 ) = 1.14 V. (displayed in the last column of the original; data table) B. When procedures call for construction of a graph, strictly adhere to the guidelines below. Discussion Write (or type) answers to the discussion questions. These answers should be long enough to answer the question, should be included in your write-up according to where the question appeared in the lab handout, and should be your own independent thinking (in other words, duplication of your lab partner's responses is unacceptable). Presentation of data and results via tables and graphs is paramount. It is a measure of your capacity to communicate what you've observed. Accordingly, the quality and accuracy of your tables and graphs will comprise a substantial portion of your lab write-up score. Data Table/Graphing Guidelines: I. Data Tables: Each table must contain the following structural items: o o o Title (simple and descriptive) Column headings: must include units; might include common abbreviations Data: typically, we'll work with no more than three significant figures Example Current and Voltage for Resistor #1 Rheostat position Voltage, V (volts) Current, I (amps) 1 2 3 0.06 0.12 0.22 0.0020 0.0037 0.0069 Resistance, R** (ohms) 30.0 32.4 31.9 **Calculated values II. Graphs Each graph must be constructed according to the following guidelines: Necessary components: o o o o Title Labeled axes, including units Consistent increments Unabridged axes Additional guidelines: o o o o o Data points should be indicated by a circled point. When warranted, a best fit curve (or line) connecting the data points should be drawn smoothly with a fine-pointed writing implement. Unless specified, plot only one set of data on each graph. Graphs should be drawn on a minimum half page of paper. Graphs drawn on other than graph paper are not graphs.


