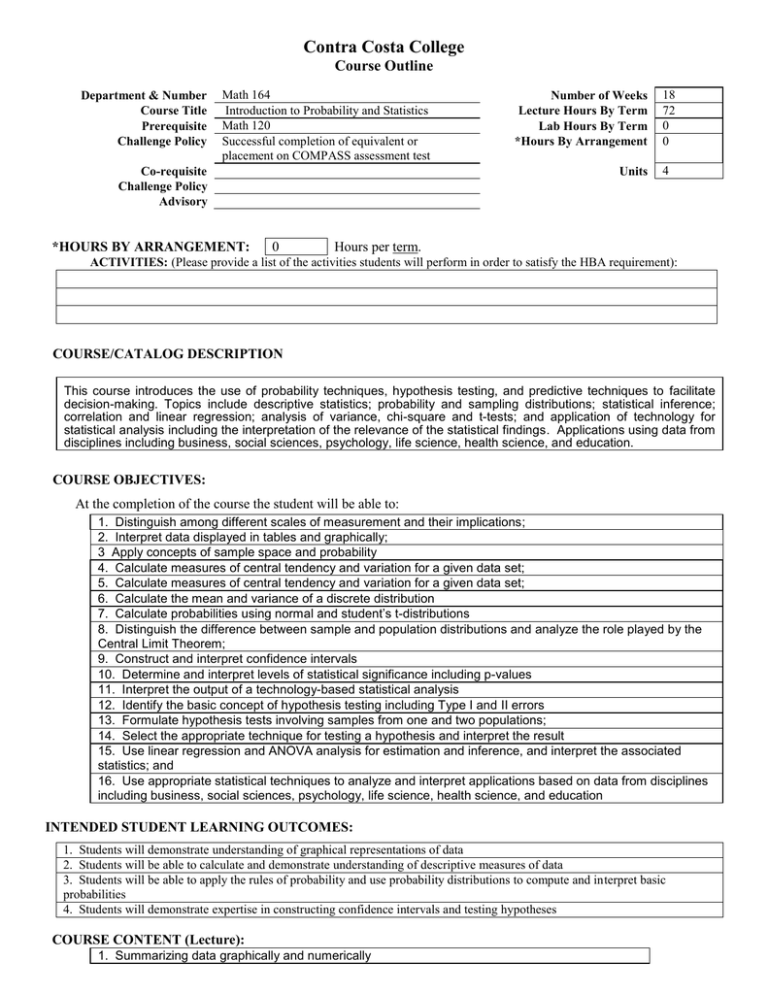
Contra Costa College
Course Outline
Department & Number
Course Title
Prerequisite
Challenge Policy
Math 164
Introduction to Probability and Statistics
Math 120
Successful completion of equivalent or
placement on COMPASS assessment test
Co-requisite
Challenge Policy
Advisory
*HOURS BY ARRANGEMENT:
Number of Weeks
Lecture Hours By Term
Lab Hours By Term
*Hours By Arrangement
Units
0
18
72
0
0
4
Hours per term.
ACTIVITIES: (Please provide a list of the activities students will perform in order to satisfy the HBA requirement):
COURSE/CATALOG DESCRIPTION
This course introduces the use of probability techniques, hypothesis testing, and predictive techniques to facilitate
decision-making. Topics include descriptive statistics; probability and sampling distributions; statistical inference;
correlation and linear regression; analysis of variance, chi-square and t-tests; and application of technology for
statistical analysis including the interpretation of the relevance of the statistical findings. Applications using data from
disciplines including business, social sciences, psychology, life science, health science, and education.
COURSE OBJECTIVES:
At the completion of the course the student will be able to:
1. Distinguish among different scales of measurement and their implications;
2. Interpret data displayed in tables and graphically;
3 Apply concepts of sample space and probability
4. Calculate measures of central tendency and variation for a given data set;
5. Calculate measures of central tendency and variation for a given data set;
6. Calculate the mean and variance of a discrete distribution
7. Calculate probabilities using normal and student’s t-distributions
8. Distinguish the difference between sample and population distributions and analyze the role played by the
Central Limit Theorem;
9. Construct and interpret confidence intervals
10. Determine and interpret levels of statistical significance including p-values
11. Interpret the output of a technology-based statistical analysis
12. Identify the basic concept of hypothesis testing including Type I and II errors
13. Formulate hypothesis tests involving samples from one and two populations;
14. Select the appropriate technique for testing a hypothesis and interpret the result
15. Use linear regression and ANOVA analysis for estimation and inference, and interpret the associated
statistics; and
16. Use appropriate statistical techniques to analyze and interpret applications based on data from disciplines
including business, social sciences, psychology, life science, health science, and education
INTENDED STUDENT LEARNING OUTCOMES:
1. Students will demonstrate understanding of graphical representations of data
2. Students will be able to calculate and demonstrate understanding of descriptive measures of data
3. Students will be able to apply the rules of probability and use probability distributions to compute and interpret basic
probabilities
4. Students will demonstrate expertise in constructing confidence intervals and testing hypotheses
COURSE CONTENT (Lecture):
1. Summarizing data graphically and numerically
2. Descriptive statistics: measures of central tendency, variation, relative position, and
levels/scales of measurement
3. Sample spaces and probability
4. Random variables and expected value
5. Sampling and sampling distributions
6. Discrete distributions – Binomial
7. Continuous distributions – Normal
8. The Central Limit Theorem
9. Estimation and confidence intervals
10. Hypothesis Testing and inference, including t-tests for one and two populations, and Chisquare test
11. Correlation and linear regression and analysis of variance (ANOVA);
12. Applications using data from disciplines including business, social sciences, psychology, life
science, health science, and education; and
13. Statistical analysis using technology such as SPSS, EXCEL, Minitab, or graphing calculators.
COURSE CONTENT (Lab):
METHODS OF INSTRUCTION:
1. Lecture/Discussion/Demonstration
2. Homework Assignments
INSTRUCTIONAL MATERIALS:
NOTE: To be UC/CSU transferable, the text must be dated within the last 7 years OR a statement of justification for a text beyond the
last 7 years must be included.
Textbook Title:
Author:
Publisher:
Edition/Date:
Textbook Reading Level:
Justification Statement:
Fundamentals of Statistics
Michael Sullivan, III
Pearson-Prentice Hall
4th Edition, 2013
(For textbook beyond 7 years)
Lab Manual Title (if applicable):
Author:
Publisher:
Edition/Date:
OUTSIDE OF CLASS WEEKLY ASSIGNMENTS:
Title 5, section 55002.5 establishes that a range of 48 -54hours of lecture, study, or lab work is required for one unit of credit.
For each hour of lecture, students should be required to spend an additional two hours of study outside of class to earn one
unit of credit.
State mandates that sample assignments must be included on the Course Outline of Record.
Outside of Class Weekly Assignments
Weekly Reading Assignments (Include detailed assignment below, if applicable)
Hours per week
3-4
Students are responsible for reading the sections of the textbook corresponding to the week’s lectures. The number
of sections covered per week may vary between 2 and 4. For the adopted text listed above, this translates to
approximately 20 – 40 pages of reading per week.
Weekly Writing Assignments (Include detailed assignment below, if applicable)
Weekly Math Problems (Include detailed assignment below, if applicable)
5-10
Students are assigned homework exercises by chapter, and are expected to complete the exercises as the material is
covered in lecture. A typical assignment includes at least 10 – 15 problems per section of the text; this translates to
a minimum of between 20 – 60 homework exercises per week. Note: 5 – 10 hours per week represents the
minimum amount of time a student will spend on homework exercises
Lab or Software Application Assignments (Include detailed assignment below, if applicable)
Other Performance Assignments (Include detailed assignment below, if applicable)
STUDENT EVALUATION: (Show percentage breakdown for evaluation instruments)
Course must require use of critical thinking, college-level concepts & college-level learning skills.
For degree credit, course requires essay writing unless that requirement would be inappropriate to the course objectives. If writing
is inappropriate, there must be a requirement of problem-solving or skills demonstration.
% Essay (If essay is not included in assessment, explain below.)
25
75
%
%
%
Computation or Non-computational Problem Solving Skills
Skills Demonstration
Objective Examinations
Other (describe)
%
%
%
GRADING POLICY: (Choose LG, P/NP, or SC)
Pass / No Pass
x Letter Grade
90% - 100% = A
80% - 89% = B
70% - 79% = C
60% - 69% = D
Below 60% = F
70% and above = Pass
Below 70% = No Pass
Prepared by: Terrill Mead
Date: 3/4/14
Revised form 01/14
Student Choice
90% - 100% = A
80% - 89% = B
70% - 79% = C
60% - 69% = D
Below 60% = F
or
70% and above = Pass
Below 70% = No Pass


