Old Test1
advertisement

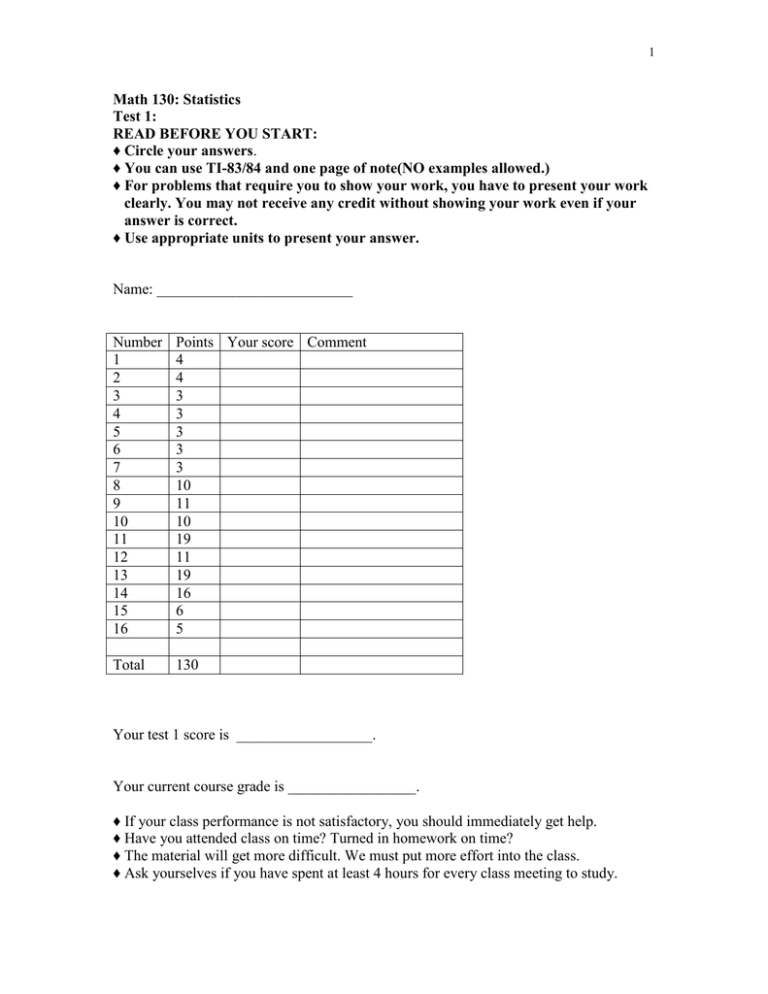
1 Math 130: Statistics Test 1: READ BEFORE YOU START: ♦ Circle your answers. ♦ You can use TI-83/84 and one page of note(NO examples allowed.) ♦ For problems that require you to show your work, you have to present your work clearly. You may not receive any credit without showing your work even if your answer is correct. ♦ Use appropriate units to present your answer. Name: __________________________ Number 1 2 3 4 5 6 7 8 9 10 11 12 13 14 15 16 Points Your score Comment 4 4 3 3 3 3 3 10 11 10 19 11 19 16 6 5 Total 130 Your test 1 score is __________________. Your current course grade is _________________. ♦ If your class performance is not satisfactory, you should immediately get help. ♦ Have you attended class on time? Turned in homework on time? ♦ The material will get more difficult. We must put more effort into the class. ♦ Ask yourselves if you have spent at least 4 hours for every class meeting to study. 2 1. In each statement that follows, tell whether descriptive or inferential statistics have been used. [4] (a) The median household income for people aged 25-34 is $37,888. _____________________ (b) The chance that a person will be robbed in a certain city is 13%. _____________________ 2. Classify each variable as qualitative or quantitative. [4] (a) Classification of children in a day care center (infant, toddler, preschool). __________________ (b) Number of off-road vehicles sold in the United States. __________________ 3. [3] If you were told that only four students from a class of twenty were surveyed for the grade poll, this would be an example of (a) sampling (b) surveying (c) interviewing (d) organizing 4. [3] What level of measurement classifies data into mutually exclusive, exhausting categories in which no order or ranking can be imposed on the data? (a) nominal (b) ordinal (c) interval (d) ratio 5. [3] What type of sampling is being employed if the country is divided into economic classes and a sample is chosen from each class to be surveyed? (a) random sampling (b) systematic sampling (c) stratified sampling (d) cluster sampling 6. [3] Karen is constructing a pie graph to represent the number of hours her classmates do homework each day. She found that 3 out of 24 classmates did homework for 3 hours each day. In her pie graph, this would represent how many degrees? (a) 135º (b) 45º (c) 120º (d) 240º 7. [3] Is the study observational or experimental? A researcher finds that people who are more hostile have higher total cholesterol levels than those who are less hostile. 3 8. Miguel scored 98 on a statistics test with Professor Alvarez that has a mean of 80 and a standard deviation of 10. Melody scored 67 on a statistics test with Professor Bueno that has a mean of 55 and standard deviation of 8. Who did better? Use a measure in statistics to justify your answer. [5] Which class was more variable in test scores? Use a statistics measure to justify your answer.] [5] 9. A sample of the hourly wages of employees who work in restaurants in a large city has a mean of $ 8.75 and a standard deviation of $0.80. [10] Find the range about the mean wage that at least 70% of the restaurant employees sampled in a large city will fall. At least how many percent of the restaurant employees sampled will have average wage between $6.91 and $10.59? 10. Shown here is the number of new theater productions that appeared on Broadway for the past several years. 30, 28, 33, 29, 37, 39, 35, 39, 37, 38, 34, 35 Do not use TI-83/84 for this problem. (a) [4] Find the first quartile, the median, and the third quartile for this data set. (b) [3] Use the first quartile you obtained in part(a) to make a statement about the number of new productions. © [3] Use the median you obtained in part(a) to make a statement about the number of new productions. 11. In a survey of 20 patients who smoked, the following data were obtained. Each value represents the number of cigarettes the patient smoked per day. 10 18 8 14 6 13 14 12 22 15 13 15 17 5 19 11 11 16 9 11 4 (a) [2] What is the variable in this data set? __________________________ (b) [6] Construct a frequency distribution, using six classes. (The first class starts with 5.) The class width is ____________________. Class limits Class boundaries Tally Frequency (c) [3] Find the modal class and interpret it in words. (d) [5] Construct a histogram from this frequency distribution. (e) [3] Use the histogram to describe the distribution of the number of cigarettes patients smoked per day. 5 12. A survey of 36 selected recording companies showed these numbers of days that it took to receive a shipment from the day it was ordered. Class limits (Days) 1-3 4-6 7-9 10-12 13-15 16-18 Frequency 6 8 10 7 0 5 (a) [5] Find the mean from this grouped data and interpret it in one sentence. (b) [6] Find the standard deviation and the variance. (Show your work.) 13. The following data give the time (in minutes) taken from Rio Hondo students to commute to school. 10 28 50 32 65 17 33 27 48 13 5 19 11 29 23 45 57 43 26 15 53 8 (a) [5] Construct a stem-and-leaf plot. (b) [3] Find five-number summary of the data set. (Use TI-83/84) (c) [5] Use IQR to check for outliers. (d) [6] Use (b) to construct a boxplot. (Use a ruler to make the boxplot accurately and clearly.) What can you say about the distribution of the commuting times of Rio Hondo College students from the box-plot? 14. The following data give the time (in minutes) taken from Rio Hondo College students to commute to school. 10 28 50 32 65 17 33 7 48 13 5 19 11 29 23 49 57 43 26 15 53 8 (a) [6] Find the percentile rank for a time of 32 minutes. (Show your work) Use one sentence to present the percentile rank you have found. 6 (b) [6] Find the 76th percentile for the commuting time data. (Show your work) Use one sentence to present your answer. (c) [4] Find the mean, mode , standard deviation and variance for this data set. (Use TI-83/84) 15. [6] An educator wants to see if there is a relationship between the number of absences as student has and his/her final grade in a course. Draw a scatter plot and comment on the nature of the relationship. What can you say about this relation from the graph. Number of absences 10 12 2 0 8 5 Final grade 70 65 96 94 75 82 16. [5] Jasmine received an C in English I (4 credits), a B in Biology (3 credits), an A in Algebra II(4 credits), a B in Psychology(3 credits) and an A in Physical Education ( 2 credits). Assuming A = 4 grade points, B= 3 grade points, C = 2 grade points, D = 1 grade point, and F = 0 grade point, find Sally’s grade point average(GPA). W English I Biology Algebra II Psychology Physical Education X


