The low-lying electronic states of FeO : Rotational analysis
advertisement
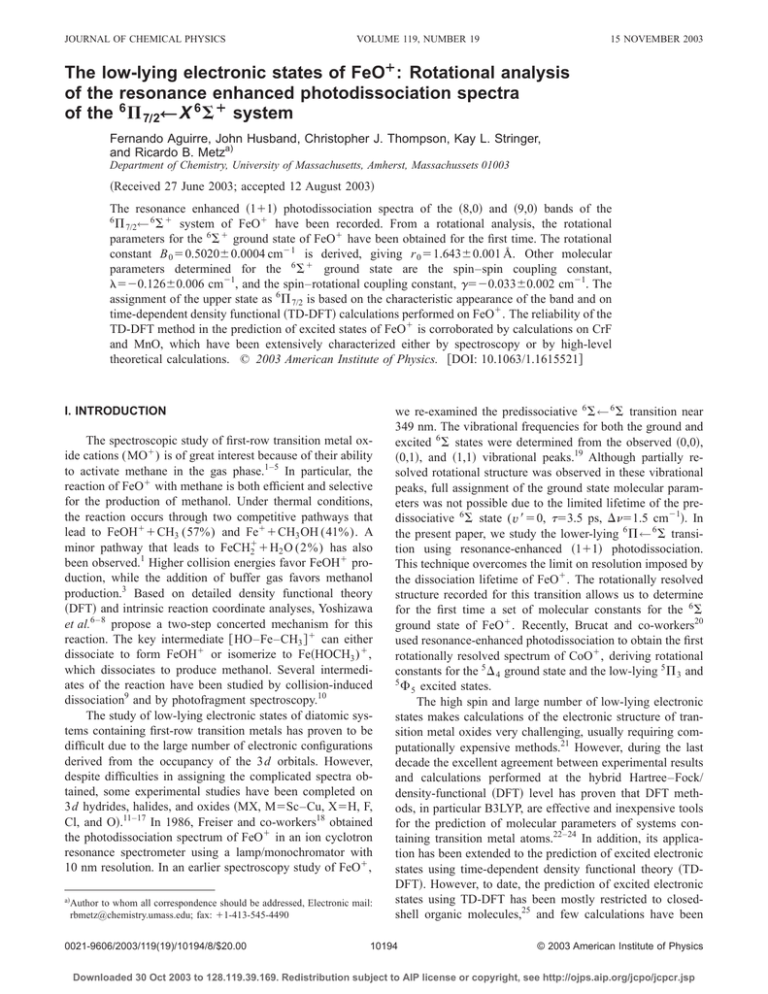
JOURNAL OF CHEMICAL PHYSICS VOLUME 119, NUMBER 19 15 NOVEMBER 2003 The low-lying electronic states of FeO¿ : Rotational analysis of the resonance enhanced photodissociation spectra of the 6 ⌸ 7Õ2] X 6 ⌺ ¿ system Fernando Aguirre, John Husband, Christopher J. Thompson, Kay L. Stringer, and Ricardo B. Metza) Department of Chemistry, University of Massachusetts, Amherst, Massachussets 01003 共Received 27 June 2003; accepted 12 August 2003兲 The resonance enhanced 共1⫹1兲 photodissociation spectra of the 共8,0兲 and 共9,0兲 bands of the 6 ⌸ 7/2← 6 ⌺ ⫹ system of FeO⫹ have been recorded. From a rotational analysis, the rotational parameters for the 6 ⌺ ⫹ ground state of FeO⫹ have been obtained for the first time. The rotational constant B 0 ⫽0.5020⫾0.0004 cm⫺1 is derived, giving r 0 ⫽1.643⫾0.001 Å. Other molecular parameters determined for the 6 ⌺ ⫹ ground state are the spin–spin coupling constant, ⫽⫺0.126⫾0.006 cm⫺1, and the spin–rotational coupling constant, ␥⫽⫺0.033⫾0.002 cm⫺1. The assignment of the upper state as 6 ⌸ 7/2 is based on the characteristic appearance of the band and on time-dependent density functional 共TD-DFT兲 calculations performed on FeO⫹ . The reliability of the TD-DFT method in the prediction of excited states of FeO⫹ is corroborated by calculations on CrF and MnO, which have been extensively characterized either by spectroscopy or by high-level theoretical calculations. © 2003 American Institute of Physics. 关DOI: 10.1063/1.1615521兴 I. INTRODUCTION The spectroscopic study of first-row transition metal oxide cations (MO⫹ ) is of great interest because of their ability to activate methane in the gas phase.1–5 In particular, the reaction of FeO⫹ with methane is both efficient and selective for the production of methanol. Under thermal conditions, the reaction occurs through two competitive pathways that lead to FeOH⫹ ⫹CH3 (57%) and Fe⫹ ⫹CH3 OH (41%). A minor pathway that leads to FeCH⫹ 2 ⫹H2 O (2%) has also been observed.1 Higher collision energies favor FeOH⫹ production, while the addition of buffer gas favors methanol production.3 Based on detailed density functional theory 共DFT兲 and intrinsic reaction coordinate analyses, Yoshizawa et al.6 – 8 propose a two-step concerted mechanism for this reaction. The key intermediate 关 HO–Fe–CH3 兴 ⫹ can either dissociate to form FeOH⫹ or isomerize to Fe共HOCH3 ) ⫹ , which dissociates to produce methanol. Several intermediates of the reaction have been studied by collision-induced dissociation9 and by photofragment spectroscopy.10 The study of low-lying electronic states of diatomic systems containing first-row transition metals has proven to be difficult due to the large number of electronic configurations derived from the occupancy of the 3d orbitals. However, despite difficulties in assigning the complicated spectra obtained, some experimental studies have been completed on 3d hydrides, halides, and oxides 共MX, M⫽Sc–Cu, X⫽H, F, Cl, and O兲.11–17 In 1986, Freiser and co-workers18 obtained the photodissociation spectrum of FeO⫹ in an ion cyclotron resonance spectrometer using a lamp/monochromator with 10 nm resolution. In an earlier spectroscopy study of FeO⫹ , a兲 Author to whom all correspondence should be addressed, Electronic mail: rbmetz@chemistry.umass.edu; fax: ⫹1-413-545-4490 0021-9606/2003/119(19)/10194/8/$20.00 we re-examined the predissociative 6 ⌺← 6 ⌺ transition near 349 nm. The vibrational frequencies for both the ground and excited 6 ⌺ states were determined from the observed 共0,0兲, 共0,1兲, and 共1,1兲 vibrational peaks.19 Although partially resolved rotational structure was observed in these vibrational peaks, full assignment of the ground state molecular parameters was not possible due to the limited lifetime of the predissociative 6 ⌺ state ( v ⬘ ⫽0, ⫽3.5 ps, ⌬⫽1.5 cm⫺1兲. In the present paper, we study the lower-lying 6 ⌸← 6 ⌺ transition using resonance-enhanced 共1⫹1兲 photodissociation. This technique overcomes the limit on resolution imposed by the dissociation lifetime of FeO⫹ . The rotationally resolved structure recorded for this transition allows us to determine for the first time a set of molecular constants for the 6 ⌺ ground state of FeO⫹ . Recently, Brucat and co-workers20 used resonance-enhanced photodissociation to obtain the first rotationally resolved spectrum of CoO⫹ , deriving rotational constants for the 5 ⌬ 4 ground state and the low-lying 5 ⌸ 3 and 5 ⌽ 5 excited states. The high spin and large number of low-lying electronic states makes calculations of the electronic structure of transition metal oxides very challenging, usually requiring computationally expensive methods.21 However, during the last decade the excellent agreement between experimental results and calculations performed at the hybrid Hartree–Fock/ density-functional 共DFT兲 level has proven that DFT methods, in particular B3LYP, are effective and inexpensive tools for the prediction of molecular parameters of systems containing transition metal atoms.22–24 In addition, its application has been extended to the prediction of excited electronic states using time-dependent density functional theory 共TDDFT兲. However, to date, the prediction of excited electronic states using TD-DFT has been mostly restricted to closedshell organic molecules,25 and few calculations have been 10194 © 2003 American Institute of Physics Downloaded 30 Oct 2003 to 128.119.39.169. Redistribution subject to AIP license or copyright, see http://ojps.aip.org/jcpo/jcpcr.jsp Electronic states of FeO⫹ J. Chem. Phys., Vol. 119, No. 19, 15 November 2003 performed on systems containing transition-metal atoms.26,27 In a recent TD-DFT study, Borowsky and Broclawik26 predicted excited states of VO ( 4 ⌺ ⫺ ) and MoO ( 5 ⌸) that are in excellent agreement with both experimental results and calculations performed at higher levels of theory. In the present study, we performed theoretical calculations on FeO⫹ using TD-DFT methods to complement the spectroscopic results and to obtain a better understanding of the electronic structure of FeO⫹ . To test the reliability of the TD-DFT method on FeO⫹ , we performed calculations on the isoelectronic MnO and CrF systems, which have been extensively characterized by both spectroscopy28 –31 and high level quantum calculations.32 Besides its considerable interest as a model for methane activation, FeO⫹ is also important in the iron chemistry of the mesosphere,33 where it is produced by the reaction of Fe⫹ , introduced by meteorites, with ozone. Kopp et al.34 estimated the concentration of atomic oxygen in the mesosphere using measured concentrations of Fe⫹ , FeO⫹ , and O3 , and the known rates for the Fe⫹ ⫹O3 and FeO⫹ ⫹O reactions. In addition, the relatively high astronomical abundance of iron has lead to considerable interest in the search for iron-containing molecules and ions in dense molecular clouds using radio astronomy.35 The positive identification of molecules and ions in the interstellar medium requires the knowledge of accurate molecular parameters, especially rotational transition energies.36 Recently, neutral FeO was tentatively identified in the interstellar medium, based on radio astronomy37 and laboratory microwave spectra.38 Thus, we hope that the rotational constants of FeO⫹ derived in this study stimulate microwave and radio astronomy studies of FeO⫹ . II. EXPERIMENTAL SECTION The laser ablation photofragment spectrometer has been described in detail previously.19 Briefly, iron cations are generated by laser ablation of a rotating and translating rod 共Fe, Sigma-Aldrich, 99.98% pure兲. Ablated Fe⫹ reacts with N2 O 共Merriam-Graves, 99.8% pure兲 to produce FeO⫹ ⫹N2 . Gas mixtures of 1% – 2% N2 O and 5% – 10% O2 in helium were typically used with a backing pressure of 2 atm. Molecular oxygen was included in the mix to enhance vibrational and electronic cooling of the FeO⫹ . Ions produced in the source expand supersonically into vacuum, then are skimmed, accelerated to 1800 V kinetic energy and rereferenced39 to ground potential prior to entering the field-free flight tube. The photoexcitation of FeO⫹ is accomplished at the turning point of the reflectron using the fundamental output of a tunable Nd:YAG-pumped dye laser 共0.08 cm⫺1 linewidth兲. The charged dissociation fragments are identified by their subsequent flight times to a 40 mm diam dual microchannel plate detector. Photofragment spectra are obtained by monitoring the yield of Fe⫹ as a function of wavelength and normalizing to the parent ion signal at a constant laser power. The wavelength of the dissociation laser is calibrated using the known photoacoustic spectrum of water.40 At the wavelengths used in this study, the photodissociation of FeO⫹ requires the absorption of two photons. A typical laser fluence of 150 mJ cm⫺2 was used to produce a maximum dis- 10195 FIG. 1. Survey scan 共step size ⬃1 cm⫺1兲 of the resonance-enhanced 共1⫹1兲 h h photodissociation FeO⫹ → FeO⫹ * → Fe⫹ ⫹O. sociation yield of 1% at 689 nm. At higher laser fluences, up to 400 mJ cm⫺2, the photodissociation spectrum of FeO⫹ becomes less resolved and the peak intensities are distorted. Laser power dependence studies are consistent with resonance-enhanced 共1⫹1兲 photodissociation, in which the absorption of the first photon to a state below the dissociation limit is partially saturated. Excited ions then absorb an additional photon and dissociate. III. COMPUTATIONAL DETAILS All calculations were carried out using the B3LYP hybrid Hartree–Fock/density functional method as implemented in the GAUSSIAN 98 program package.41 Geometry optimizations and frequency calculations were performed using the diffuse 6-311⫹G共d,p兲 basis set on all the atoms. Single-point energy calculations at the optimized geometry were obtained using the 6-311⫹G共3df,2dp兲 basis set on oxygen, while the 6-311⫹G共d,p兲 basis set was retained for iron. The time-dependent density functional theory 共TD-DFT兲 calculations were performed at the B3LYP level using the 6-311 ⫹G共d,p兲 basis set on all the atoms, except for FeO⫹ , where no diffuse functions were added. Potential energy curves were constructed by scanning the M–X 共M⫽Fe, Mn and Cr; X⫽O, F兲 bond length while performing TD calculations from the converged ground state density at each step. The internuclear distance is scanned until a poor description of the electronic transition, such as a negative vertical energy, is obtained in the TD-DFT calculation. A typical scan is carried out with a step size of 0.04 Å and usually covers a range of ⫾0.3 Å from the optimized bond length of the system in its ground state. The calculated potential energy curves are subsequently fit to a Morse potential to derive the vibrational constants ( e , e x e ) of each excited state. IV. RESULTS AND DISCUSSION A. Spectroscopy Figure 1 shows a survey resonance-enhanced photodissociation spectrum of FeO⫹ between 14 150 and 14 800 Downloaded 30 Oct 2003 to 128.119.39.169. Redistribution subject to AIP license or copyright, see http://ojps.aip.org/jcpo/jcpcr.jsp 10196 J. Chem. Phys., Vol. 119, No. 19, 15 November 2003 Aguirre et al. FIG. 2. Resonance-enhanced 共1⫹1兲 photodissociation spectra and rotational assignments of the 共a兲 共8,0兲 band and 共b兲 共9,0兲 band of the 6 ⌸ 7/2← 6 ⌺ ⫹ system of FeO⫹ . The subscripts indicate the spin component of the 6 ⌺ state (F 1 is ⌺⫽5/2兲, while the superscripts indicate ⌬N for the transition. cm⫺1. The spectrum consists of an intense band at ⬃14 500 cm⫺1 and four less intense, neighboring bands. The average spacing between these bands is 65 cm⫺1. Although this survey spectrum was also recorded at somewhat higher resolution, we concentrate our analysis on the most intense band, which is the only feature recorded with a high signal-to-noise level. Figure 2共a兲 shows the high-resolution spectrum of the intense band. The spectrum consists of approximate 50 rotational peaks distributed along a ⬃45 cm⫺1 region. Among the most significant features in this spectrum are the two band heads at 14 514.3 and 14 520.9 cm⫺1. Considering that both band heads are shaded toward the red, the internuclear distance in the upper electronic state must be greater than that in the ground state (B ⬘ ⬍B ⬙ ), and therefore they correspond to either R or Q branches.42 Other distinguishing features of the spectrum are the isolated band and the progression of doublets observed at the high- and low-energy regions, respectively. The typical linewidth of an isolated peak in the spectrum is 0.08 cm⫺1, our laser linewidth. The spectrum in Fig. 2共b兲 shows a similar, but less intense band that resides ⬃646 cm⫺1 to the blue of the most intense band. The strikingly similarity between the spectra in Figs. 2共a兲 and 2共b兲 indicates that these rotational features are produced by transitions to two vibrational states in the same excited electronic state of FeO⫹ . Therefore, to determine the absolute vibrational numbering of these transitions, we searched for the photodissociation of the 54FeO⫹ isotopomer. The small natural abundance of 54Fe (5.8%) and low dissociation yield 共⬍1%兲 make this experiment quite challenging. The photodissociation of 54FeO⫹ gives a small peak at 14 514.3 cm⫺1, which gives an isotopic shift of 21.1 cm⫺1 from the intense band head of 56FeO⫹ . Considering that under our experimental conditions FeO⫹ ions are produced in their vibrationless ground state, the large isotopic shift indicates that high vibrational levels of the upper electronic state of FeO⫹ are reached upon photoexcitation. On the basis of this isotopic shift and the vibrational frequency of the ground state of FeO⫹ ( ⬙0 ⫽838⫾4 cm⫺1 ) derived in an earlier study,19 the rotational features shown in Figs. 2共a兲 and 2共b兲 are tentatively assigned as the ( v ⬘ ⫽8← v ⬙ ⫽0) and ( v ⬘ ⫽9← v ⬙ ⫽0) bands, respectively. They will henceforth be referred to as the 共8,0兲 and 共9,0兲 bands. The analysis of these bands was carried out in several steps. Since the ground state of FeO⫹ is 6 ⌺ ⫹ and the band Downloaded 30 Oct 2003 to 128.119.39.169. Redistribution subject to AIP license or copyright, see http://ojps.aip.org/jcpo/jcpcr.jsp Electronic states of FeO⫹ J. Chem. Phys., Vol. 119, No. 19, 15 November 2003 Transitions can occur from each spin–spin level in the ⌺ state to each spin–orbit level in the 6 ⌸ state, leading to 18 branches for each spin–orbit state 6 ⌸ ⍀ , with expected intensities R⬎Q⬎ P for the rotational branches. The analysis of the rotational structure was started with the 共9,0兲 band 关Fig. 2共b兲兴 because the branches are easier to pick out since more peaks are available. To start the analysis two branches were selected: the isolated peaks above 15 169 cm⫺1 were assigned to an R branch, while those forming a head near 15 167 cm⫺1 to a Q branch. Combination differences between these bands allows us to obtain the separation of successive rotational levels in the ground and excited states. The corresponding P branch was predicted to lie near 15 160 cm⫺1, but it could not be confirmed because it is obscured by other branches. The assignment of the analogous features in the 共8,0兲 band gives similar rotational energy levels for the ground state. Fitting the rotational energies to Eqs. 共1兲 and 共2兲 determines J ⬘ as well as J ⬙ and N ⬙ . Using J ⬙ ⫽⍀ ⬙ ⫹N ⬙ allow us to obtain ⍀⬙. It is more difficult to determine ⍀⬘. The lowest J ⬘ value observed places an upper limit on 兩⍀⬘兩 共as J ⬘ ⭓ 兩 ⍀ ⬘ 兩 ) but transitions to low J ⬘ are often overlapped by other peaks. The value of ⍀⬘ affects the overall intensity pattern and the extent of ⌳ doubling. These considerations, discussed in more detail below, strongly suggest ⍀⬘⫽7/2. Thus, we assign these as the Q and R branches of ⫹ transition. As the 6 ⌺ states are numbered the 6 ⌸ 7/2← 6 ⌺ 5/2 from F 1 (⌺⫽5/2) to F 6 (⌺⫽⫺5/2), these are the P Q 1 and Q R 1 bands, where the superscript indicates ⌬N for the transition. As a next step, an additional branch located in the region between the two band heads of the spectrum was assigned. Using the rotational energy levels derived for the ground state facilitates assignment of the remaining peaks near 15 165 cm⫺1 to the P R 2 branch ( 6 ⌸ 7/2← 6 ⌺ 3/2). The remainder of the spectrum exhibits a similar pattern with the red-shaded O Q 2 and O R 3 forming the sharp peak at 15 161 cm⫺1 and the highly red-shaded N Q 3 and N R 4 extending shown in Fig. 2共a兲 is the only intense feature observed between 14 300 and 14 700 cm⫺1, a seemingly natural starting point to the analysis is that this band is derived from a 6 ⌺ ← 6 ⌺ ⫹ transition. The observation of a similar transition29 for isoelectronic MnO supports this idea. However, this tentative assignment was revised when the rotational structure was examined closely and found to be incompatible with a 6 ⌺← 6 ⌺ ⫹ transition. Our second approach to the analysis is that these bands are due to a 6 ⌸← 6 ⌺ ⫹ transition. Transitions to a 6 ⌸ state are supported by TD-DFT calculations performed on FeO⫹ , which are described in detail later in this paper. In the case of a 6 ⌸← 6 ⌺ ⫹ transition, neighboring subbands due to transitions from the 6 ⌺ ⫹ ground state to the spin–orbit components of the 6 ⌸ state should be also observed. The spin–orbit splitting in the 6 ⌸ state can be estimated using atomic parameters.43 Assuming the spin–orbit interaction arises from an electron in the Fe 3d orbital, A⌳⌺⫽ 3d /2, where 3d is the atomic spin–orbit constant. Therefore, for the highest spin–orbit component of the 6 ⌸ state 共⌺⫽5/2, ⌳⫽1兲, A⬇ 3d /5. So, using 3d ⫽416 cm⫺1 for Fe⫹ gives A⫽83 cm⫺1 . This estimate is consistent with the average spacing of 65 cm⫺1 observed between the bands in the low-resolution scan shown in Fig. 1. 6 ⌸← 6 ⌺ bands have been observed for several molecules, and their structure is fairly complex. The 6 ⌺ state is Hund’s case 共b兲 with rotational energy levels approximately given by42 E r⬙ ⫽B ⬙ N ⬙ 共 N ⬙ ⫹1 兲 . 6 共1兲 Spin–spin 共second-order spin–orbit兲 and spin-rotation interaction split the 6 ⌺ state into six spin–spin levels 共⌺⫽5/2, 3/2, 1/2, ⫺1/2, ⫺3/2, and ⫺5/2兲 and cause the energies to differ slightly from Eq. 共1兲. The 6 ⌸ state is Hund’s case 共a兲 and thus approximately has rotational energy levels,42 E r⬘ ⫽B ⬘ 关 J ⬘ 共 J ⬘ ⫹1 兲 ⫺⍀ ⬘ 2 兴 . 10197 共2兲 TABLE I. Experimental molecular constants 共cm⫺1兲 of the X 6 ⌺ ⫹ , 6 ⌸ 7/2 , and 共revised兲 6 ⌺ states of FeO⫹ , and the 6 ⌺ ⫹ ground state of MnO. FeO⫹ X 6⌺ ⫹ Constant v ⬙ ⫽0 T0 0 B 0.5020⫾ 0.0004 Dc r (Å) ␥ 7⫻10⫺7 1.643⫾ 0.001 ⫺0.126⫾ 0.006 ⫺0.033⫾ 0.002 6 MnO ⌸ 7/2 v ⬘ ⫽8 v ⬘ ⫽9 14 351.05 14 997.64 0.3752⫾ 0.0002 4⫻10⫺7 ⌺a X 6 ⌺ ⫹b v ⬘ ⫽0 v ⬙ ⫽0 6 0.3720⫾ 0.0002 4⫻10⫺7 28 647.0 共28 648.7兲 0.489⫾ 0.006 共0.484兲 1.664⫾0.01 0.60⫾0.07 共0.7兲 0 0.5012 1.647 0.574 ⫺0.0024 Molecular constants in parentheses were estimated in an earlier one-photon spectroscopic study 共Ref. 19兲 using the ground state molecular parameters of the isoelectronic MnO 共Refs. 29–31兲 for the ground state of FeO⫹ . b Reference 31. c Estimated, but not fit. a Downloaded 30 Oct 2003 to 128.119.39.169. Redistribution subject to AIP license or copyright, see http://ojps.aip.org/jcpo/jcpcr.jsp 10198 Aguirre et al. J. Chem. Phys., Vol. 119, No. 19, 15 November 2003 TABLE II. Experimental and calculated 共parentheses兲 line positions of the 共8,0兲 band of the 6 ⌸ 7/2← 6 ⌺ ⫹ system of FeO⫹ . J⬙ R1 R2 2.5 14 516.43 共14 516.343兲 18.72 共18.670兲 20.94 共20.899兲 22.98 共22.942兲 24.78 共24.774兲 26.41 共26.387兲 27.81 共27.772兲 14 517.17 共14 517.141兲 18.33 共18.353兲 19.33 共19.361兲 20.11 共20.154兲 20.69 共20.726兲 21.03 共21.07兲 3.5 4.5 5.5 6.5 7.5 8.5 R4 Q1 14 508.75 共14 508.809兲 07.79 共07.831兲 06.57 共06.612兲 05.14 共05.154兲 03.42 共03.460兲 01.49 共01.533兲 14 499.37 共14 499.372兲 97.02 共96.979兲 94.40 共94.353兲 9.5 10.5 11.5 12.5 14 515.26 共14 515.190兲 16.66 共16.646兲 17.91 共17.917兲 18.99 共18.976兲 19.80 共19.815兲 13.5 down to 15 145 cm⫺1. Rotational constants are derived by nonlinear least squares fitting of the observed transition energies to the Hamiltonian, Q3 14 509.20 共14 509.190兲 08.18 共08.218兲 06.99 共07.009兲 05.56 共05.567兲 03.86 共03.892兲 01.96 共01.986兲 14 499.84 共14 499.850兲 97.51 共97.480兲 94.91 共94.882兲 2 2 HLD⫽ 共 o v ⫹ p v ⫹q v 兲共 S⫹ ⫹S⫺ 兲 ⫺ 共 p v ⫹2q v 兲 2 2 ⫻ 共 J⫹ S⫹ ⫹J⫺ S⫺ 兲 ⫹q v 共 J⫹ ⫹J⫺ 兲, 共5兲 H⫽B 共 J⫺S兲 2 ⫺D 共 J⫺S兲 4 ⫹ ␥ 共 J⫺S兲 S⫹ 共2/3兲 共 3Sz2 ⫺S2 兲 , 共3兲 for the 6 ⌺ state and H⫽B 共 J⫺S兲 2 ⫺D 共 J⫺S兲 4 ⫹A⌳⌺⫹HLD , 共4兲 for the 6 ⌸ state. The Hamiltonians are diagonalized in a Hund’s case 共a兲 basis and transition intensities are obtained following the procedure outlined by Hougen.44 Case 共a兲 matrix elements TABLE III. Experimental and calculated 共parentheses兲 rotational lines of the 共9,0兲 band of the 6 ⌸ 7/2← 6 ⌺ ⫹ system of FeO⫹ . Additional lines included in the fit 共with the predicted energy in parentheses兲: R 3 (11.5) 15 155.59 共15 155.576兲, R 3 (12.5) 15 153.90 共15 153.888兲, and Q 4 (4.5) 15 151.07 共15 151.112兲. J⬙ R1 R2 2.5 15 162.98 共15 162.930兲 65.25 共65.227兲 67.45 共67.419兲 69.44 共69.417兲 71.23 共71.198兲 72.76 共72.752兲 74.06 共74.073兲 75.17 共75.162兲 15 162.36 共15 162.340兲 63.68 共63.697兲 64.85 共64.872兲 65.80 共65.836兲 66.57 共66.578兲 67.08 共67.091兲 3.5 4.5 5.5 6.5 7.5 8.5 9.5 10.5 11.5 R4 Q1 15 156.08 共15 156.088兲 55.29 共55.328兲 54.30 共54.306兲 53.05 共53.036兲 51.54 共51.520兲 49.77 共49.761兲 47.74 共47.764兲 45.53 共45.524兲 15 161.80 共15 161.777兲 63.17 共63.203兲 64.44 共64.437兲 65.45 共65.450兲 66.20 共66.239兲 66.75 共66.795兲 Q3 15 155.76 共15 155.710兲 54.74 共54.692兲 53.44 共53.433兲 51.93 共51.933兲 50.20 共50.192兲 48.22 共48.217兲 45.98 共46.002兲 Downloaded 30 Oct 2003 to 128.119.39.169. Redistribution subject to AIP license or copyright, see http://ojps.aip.org/jcpo/jcpcr.jsp Electronic states of FeO⫹ J. Chem. Phys., Vol. 119, No. 19, 15 November 2003 10199 for a 6 ⌺ state have been reported by Gordon and Merer,29 while those for the 6 ⌸ state were derived following the definitions of Brown and Merer.45 Table I gives the rotational constants obtained by fitting 36 unblended lines in the 共8,0兲 band and 38 lines in the 共9,0兲 band. Observed and calculated positions for all lines used in the fit are given in Tables II and III. Due to the low rotational temperature of the ion beam, the fit is quite insensitive to the centrifugal distortion constants. They were estimated42 using D⫽ 4B 3 2 , 共6兲 and were not optimized in the fit. Including lambda doubling (HLD) did not improve the fit, so it was not included in the final analysis. Lambda doubling is expected to be very small for low J values of a state with ⍀⫽7/2. The value of ⍀⬘ affects the calculated relative intensities of bands in the spectrum. Again, ⍀⬘⫽7/2 gives the best fit to observed intensities. P branch lines are predicted to be quite weak, and often lie under more intense branches. A vibrational spacing of 646.6⫾0.3 cm⫺1 is derived for the 6 ⌸ 7/2 state from the determined origins of the 共8,0兲 and 共9,0兲 bands 共Table I兲. Overall, excellent agreement is obtained between the calculated and experimental peak positions, with a root-mean square 共rms兲 error of 0.03 cm⫺1 for the 共8,0兲 and 共9,0兲 bands of the 6 ⌸ 7/2← 6 ⌺ ⫹ system of FeO⫹ . The measured Fe–O distance of r 0 ⫽1.643⫾0.001 Å is similar to the bond length of 1.647 Å in isoelectronic MnO. Fiedler et al.46 used multireference perturbation theory to calculate a bond length of 1.648 Å for FeO⫹ , in good agreement with our measurement. Our observation of transitions to v ⬘ ⫽8 and 9 suggests that the Fe–O bond stretches significantly upon excitation to the 6 ⌸ state. This is supported by the large change of the rotational constant, ⌬B ⫽0.13 cm⫺1 , observed in the transition. The rotational simulations also predict a spin–spin coupling constant ⫽⫺0.126 ⫾0.006 for the 6 ⌺ ⫹ ground state. This spin–spin coupling constant is an effective constant that contains contributions from direct spin–spin coupling and second-order spin–orbit coupling: ⫽ SS⫹ SO. The second-order spin–orbit coupling with nearby electronic states is expected to dominate eff for molecules such as FeO⫹ , which contain heavy atoms.31,43 However, the small value of for the 6 ⌺ ⫹ ground state is a little unexpected when compared to that of the 6 ⌺ ⫹ ground state of the isoelectronic MnO. It is possible that some contributions of off-diagonal second-order spin–orbit terms with opposite signs lead to this . In an earlier study19 we measured a partially resolved 6 ⌺← 6 ⌺ ⫹ transition in FeO⫹ and obtained changes in rotational and spin–spin splitting constants (⌬B and ⌬兲 using B ⬙ and ⬙ for the isoelectronic MnO. With the constants derived in the present study, we can refine our analysis of the 6 ⌺← 6 ⌺ ⫹ band. The initial and revised parameters of the 6 ⌺ excited state of FeO⫹ are listed in Table I. The ⌬r(Fe–O) is almost unchanged, which is expected since the ground state bond lengths of FeO⫹ and the isoelectronic MnO are very similar. On the other hand, the change in the spin–spin coupling constant 共⌬兲 is produced by the significant difference FIG. 3. Ground and several excited sextet states of FeO⫹ . Symbols are the results of TD-DFT calculations. The solid 共⌺ states兲 and dotted 共⌸ states兲 curves are Morse potentials fit to the calculated energies. The calculated r e is indicated by the vertical line at 1.633 Å, while the horizontal line shows the experimental D 0 ⫽28 000⫾400 cm⫺1 共Ref. 47兲. between the ⬙ values of FeO⫹ and MnO. Although FeO⫹ and MnO are isoelectronic, it is expected that the difference in the total charge of these systems affects the relative energies of their electronic states,2,11 and hence the second-order spin–orbit interactions. The rotational parameters for the 6 ⌺ ⫹ ground state of FeO⫹ derived in this study 共Table I兲 represent an excellent starting point for laboratory microwave spectroscopy of FeO⫹ . Additional motivation for microwave studies comes from the recent tentative observation37 of neutral FeO toward Sagittarius B2 via radio astronomy, which raises the possibility of detecting the cation. FeO⫹ is likely to be somewhat more challenging to detect than FeO for two reasons. First, TABLE IV. Electronic states of FeO⫹ calculated using time-dependent density functional theory 共TD-DFT兲. T e (cm⫺1 ) State X 6⌺ ⫹ 6 ⫹ ⌺ 6 ⌸ 6 ⌸ 6 ⌸ r e (Å) e / e x e (cm⫺1 ) TD Exp. TD Exp TD Expa 0 27 400 12 000 16 500 23 100 0 28 729 ⬃9000b 1.633 1.671 1.792 1.787 1.837 1.638 1.664 853/5.4 925/11.4 690/5.0 730/5.4 603/4.3 849 685 736 Experimental fundamental frequencies 0 have been converted to harmonic frequencies e using the calculated 共TD兲 e x e for each electronic state. b Estimated based on the origin of the 共8,0兲 band 共14 351 cm⫺1兲 and the calculated e and e x e values of the 6 ⌸ state. a Downloaded 30 Oct 2003 to 128.119.39.169. Redistribution subject to AIP license or copyright, see http://ojps.aip.org/jcpo/jcpcr.jsp 10200 Aguirre et al. J. Chem. Phys., Vol. 119, No. 19, 15 November 2003 TABLE VI. Calculated TD-DFT electronic states of MnO. T e (cm⫺1 ) State ⫹ X ⌺ A 6⌺ ⫹ 6 FIG. 4. Molecular orbitals of FeO⫹ in its 6 ⌺ ⫹ ground state configuration, from the B3LYP calculation at r⫽1.633 Å. FeO⫹ is likely to be less abundant. Second, molecules will be distributed among more quantum states for FeO⫹ than FeO. FeO has a 5 ⌬ 4 ground state. At 20 K the J⫽5 state 共from which emission was tentatively detected兲 has ⬃25% of the population. The 6 ⌺ ground state of FeO⫹ has sufficiently small spin–spin splitting that all six spin–spin levels are significantly populated, even at 20 K. At this temperature, the most populated rotational state only has 5% of the population. On a more positive note, the two species are calculated to have similar, large dipole moments of about 5 Debye. Also, in FeO⫹ , states with the same value of N have transitions at similar energies, so the microwave transitions occur in multiplets, which simplifies confirming the carrier of an observed transition. B. Calculations To further explore the electronic structure of sextet states of FeO⫹ we performed TD-DFT calculations on this system. Figure 3 shows calculated potentials of the ground and several excited electronic states of FeO⫹ . The molecular parameters of these states are listed in Table IV. The resonant 6 ⌸ ←6⌺ transition we observe corresponds to transitions to the e / e x e (cm⫺1 ) r e (Å) TD Exp. TD Exp. TD Exp. 0 18 400 0 17 894 1.637 1.714 1.644 1.710 866/5.1 760/2.5 843 745 lowest 6 ⌸ state in Fig. 3. The 6 ⌺← 6 ⌺ band near 349 nm19 corresponds to transitions to the 6 ⌺ state near 27 400 cm⫺1 in the figure. To illustrate the electronic transitions observed in our one-photon and resonance-enhanced 共1⫹1兲 photodissociation studies of FeO⫹ and predicted by TD-DFT, we use a simple molecular orbital picture that is commonly used to describe the electronic structure of diatomic molecules containing first-row transition metals. As shown in Fig. 4, the lowest-lying valence orbitals of FeO⫹ are the 8 and 3 orbitals. The 8 orbital is predominantly ligand in character. The 3 orbitals have significant electron density on both atoms and are strongly bonding. Above these, but very close in energy, lie the nonbonding metal-centered 1␦, the weakly antibonding 4, and the essentially nonbonding metalcentered 9 orbitals. The lowest-unoccupied molecular orbital 10 is mostly antibonding. In view of this description and the TD-DFT results, the first 6 ⌸ excited state of FeO⫹ arises from promoting an electron from the 3 Fe–O bonding orbital to the 1␦ nonbonding orbital on the metal. Since this moves electron density from the oxygen to the metal, transitions to this electronic state have charge transfer character, and reduced bond order. The calculations predict a considerable increase in the bond length, as is observed. The transition to the 6 ⌺ excited state of FeO⫹ near 349 nm corresponds to promoting an electron from the weakly bonding 8 orbital to the essentially nonbonding 9 orbital. Therefore, a small increase in the bond length is expected and observed. To test the reliability of the TD-DFT methodology, we also performed calculations on the isoelectronic neutrals CrF and MnO. The results are listed in Tables V and VI, respectively. The results of the TD-DFT calculations performed on CrF are slightly worse than those obtained by Harrison et al.32 at the RCCSD共T兲 level of theory and slightly better than the values obtained by Bencheikh et al.28 using the DFT ⌬SCF schemes. Including FeO⫹ , the bond lengths, excitation energies, and vibrational frequencies are calculated with a mean error of 0.03 Å, 2000 cm⫺1, and 50 cm⫺1, respec- TABLE V. Calculated TD-DFT electronic states of CrF. T e (cm⫺1 ) State TD Exp. e / e x e (cm⫺1 ) r e (Å) Othera TD Exp. Othera TD Exp. Othera 1.783 共1.788兲 1.908 1.831 共1.818兲 620/3.9 664 550/4.6 564/4.3 581 629 679 共720兲 571 632 共699兲 X 6⌺ ⫹ 0 0 0 1.807 1.784 A 6⌺ ⫹ B 6⌸ 12 200 9900 9953 8134 9818 7551 共10 136兲 1.895 1.864 1.892 1.828 Calculations performed by Harrison et al. 共Ref. 32兲 at the RCCSD共T兲 level of theory. The values in parentheses were obtained by Bencheikh et al. 共Ref. 28兲 using the DFT ⌬SCF scheme. a Downloaded 30 Oct 2003 to 128.119.39.169. Redistribution subject to AIP license or copyright, see http://ojps.aip.org/jcpo/jcpcr.jsp Electronic states of FeO⫹ J. Chem. Phys., Vol. 119, No. 19, 15 November 2003 tively. The deviation in the calculated excitation energies is consistent with the 1500 cm⫺1 deviation obtained by Borowski and Broclawik26 in the prediction of excited states of VO and MoO using TD-DFT. Overall, the TD-DFT calculations give surprisingly accurate results, especially considering the small computational time required. One caveat is that the TD-DFT formalism is restricted to excited electronic states that are derived from a single excitation of the ground state configuration within a given manifold 共alpha/beta兲. In addition, its application may not be reliable on systems that cannot be well described using a single determinant. V. CONCLUSIONS The 共8,0兲 and 共9,0兲 bands of the 6 ⌸ 7/2← 6 ⌺ ⫹ system of FeO⫹ have been studied by resonance-enhanced 共1⫹1兲 photodissociation spectroscopy with rotational resolution. For the first time, a set of molecular parameters for the 6 ⌺ ⫹ ground state of FeO⫹ is reported. The Fe–O bond length is determined to be 1.643⫾0.001 Å, while the spin–spin 共兲 and the spin–rotational 共␥兲 coupling constants are ⫺0.126 ⫾0.006 and ⫺0.033⫾0.002 cm⫺1, respectively. Although the precision of the molecular parameters obtained in this study is not sufficiently high for a radioastronomy search for FeO⫹ in the interstellar medium, the results should greatly facilitate laboratory microwave studies of the 6 ⌺ ⫹ ground state of FeO⫹ . It is hoped that the present experiments will provide the motivation for future work in this area. We have computed excited states of FeO⫹ , MnO, and CrF using the TDDFT scheme. The excellent agreement between TD-DFT calculations and experimental and high-level calculations on these molecules indicates that TD-DFT is a reliable tool in predicting low-lying excited electronic states of small transition metal-containing systems. ACKNOWLEDGMENTS We would like to thank P. J. Brucat for helpful discussions regarding the assignment of the observed rotational structure of the 6 ⌸ 7/2← 6 ⌺ ⫹ system, W. M. Irvine for suggestions on astronomical observations, and O. Launila for providing a copy of his interactive fitting program 共INFIA兲. Support for this work by a National Science Foundation Faculty Career Development Award is gratefully acknowledged. 1 D. Schröder and H. Schwarz, Angew. Chem., Int. Ed. Engl. 29, 1433 共1990兲. 2 D. Schröder and H. Schwarz, Angew. Chem., Int. Ed. Engl. 34, 1973 共1995兲. 3 D. Schröder, H. Schwarz, D. E. Clemmer, Y. Chen, P. B. Armentrout, V. Baranov, and D. K. Bohme, Int. J. Mass Spectrom. Ion Processes 161, 175 共1997兲. 4 D. Schröder, H. Schwarz, and S. Shaik, Struct. Bonding 共Berlin兲 97, 91 共2000兲. 5 R. B. Metz, Adv. Phys. 2, 35 共2001兲. 6 K. Yoshizawa, Y. Shiota, and T. Yamabe, J. Chem. Phys. 111, 538 共1999兲. 7 K. Yoshizawa, Y. Shiota, and T. Yamabe, Chem.-Eur. J. 3, 1160 共1997兲. 8 K. Yoshizawa, Y. Shiota, and T. Yamabe, J. Am. Chem. Soc. 120, 564 共1998兲. 10201 9 D. Schröder, A. Fiedler, J. Hrusák, and H. Schwarz, J. Am. Chem. Soc. 114, 1215 共1992兲. 10 F. Aguirre, J. Husband, C. J. Thompson, K. L. Stringer, and R. B. Metz, J. Chem. Phys. 116, 4071 共2002兲. 11 A. J. Merer, Annu. Rev. Phys. Chem. 40, 407 共1989兲. 12 R. S. Ram, C. N. Jarman, and P. F. Bernath, J. Mol. Spectrosc. 161, 445 共1993兲. 13 W. J. Balfour, O. Launila, and L. Klynning, Mol. Phys. 69, 443 共1990兲. 14 T. D. Varberg, J. A. Gray, R. W. Field, and A. J. Merer, J. Mol. Spectrosc. 156, 196 共1992兲. 15 T. Carter and J. M. Brown, J. Chem. Phys. 101, 2699 共1994兲. 16 T. Oike, T. Okabayashi, and M. Tanimoto, J. Chem. Phys. 109, 3501 共1998兲. 17 J. Lei and P. J. Dagdigian, J. Chem. Phys. 112, 10221 共2000兲. 18 R. L. Hettich, T. C. Jackson, E. M. Stanko, and B. S. Freiser, J. Am. Chem. Soc. 108, 5086 共1986兲. 19 J. Husband, F. Aguirre, P. Ferguson, and R. B. Metz, J. Chem. Phys. 111, 1433 共1999兲. 20 A. Kamariotis, T. Hayes, D. Bellert, and P. J. Brucat, Chem. Phys. Lett. 316, 60 共2000兲. 21 J. F. Harrison, Chem. Rev. 100, 679 共2000兲. 22 M. N. Glukhovtsev, R. D. Bach, and C. J. Nagel, J. Phys. Chem. A 101, 316 共1997兲. 23 A. Ricca and C. W. Bauschlicher, Jr., J. Phys. Chem. A 101, 8949 共1997兲. 24 C. J. Thompson, F. Aguirre, J. Husband, and R. B. Metz, J. Phys. Chem. A 104, 9901 共2000兲. 25 K. B. Wiberg, R. E. Stratmann, and M. J. Frisch, Chem. Phys. Lett. 297, 60 共1998兲. 26 T. Borowski and E. Broclawik, Chem. Phys. Lett. 339, 433 共2001兲. 27 R. Farrell, J. V. Slageren, S. Zalis, and A. Vlcek, Inorg. Chim. Acta 315, 44 共2001兲. 28 M. Bencheikh, R. Koivisto, and O. Launila, J. Chem. Phys. 106, 6231 共1996兲. 29 M. Gordon and A. J. Merer, Can. J. Phys. 58, 642 共1980兲. 30 A. G. Adam, Y. Azuma, H. Li, A. J. Merer, and T. Chandrakumar, Chem. Phys. 152, 391 共1991兲. 31 K. Namiki and S. Saito, J. Chem. Phys. 107, 8848 共1997兲. 32 J. F. Harrison and J. H. Hutchison, Mol. Phys. 97, 1009 共1999兲. 33 T. J. Kane and C. S. Gardner, J. Geophys. Res. 98, 16875 共1993兲. 34 E. Kopp, P. Eberhardt, U. Hermann, and L. G. Bjoern, J. Geophys. Res. 90, 13041 共1985兲. 35 J. C. Weingartner and B. T. Draine, Astrophys. J. 517, 292 共1999兲. 36 T. J. Millar, C. M. Walmsley, C. Rebrion-Rowe, L. d’Hendecourt, S. Saito, and F. Rostas, IAU Symp. 197, 303 共2000兲. 37 C. M. Walmsley, R. Bachiller, G. P. Des Forets, and P. Schilke, Astrophys. J. Lett. 566, L109 共2002兲. 38 M. D. Allen, L. M. Ziurys, and J. M. Brown, Chem. Phys. Lett. 257, 130 共1996兲. 39 L. A. Posey, M. J. DeLuca, and M. A. Johnson, Chem. Phys. Lett. 131, 170 共1986兲. 40 M. Carleer, A. Jenouvrier, A. C. Vandaele et al., J. Chem. Phys. 111, 2444 共1999兲. 41 M. J. Frisch, G. W. Trucks, H. B. Schlegel et al., GAUSSIAN 98, Revision A.3 共Gaussian, Inc., Pittsburgh, PA, 1998兲. 42 G. Herzberg, Molecular Spectra and Molecular Structure. I. Spectra of Diatomic Molecules 共Van Nostrand Reinhold Company, New York, 1950兲. 43 H. Lefebvre-Brion and R. W. Field, Perturbations in the Spectra of Diatomic Molecules 共Academic, New York, 1986兲. 44 J. T. Hougen, The Calculation of Rotational Energy Levels and Rotational Intensities in Diatomic Molecules, N. B. S. Monograph 115, Washington, DC, 1970. 45 J. M. Brown and A. J. Merer, J. Mol. Spectrosc. 74, 488 共1979兲. 46 A. Fiedler, D. Schröder, S. Shaik, and H. Schwarz, J. Am. Chem. Soc. 116, 10734 共1994兲. 47 P. B. Armentrout and B. L. Kickel, in Organometallic Ion Chemistry, edited by B. S. Freiser 共Kluwer Academic, Dordrecht, The Netherlands, 1994兲. Downloaded 30 Oct 2003 to 128.119.39.169. Redistribution subject to AIP license or copyright, see http://ojps.aip.org/jcpo/jcpcr.jsp
