WISCONSIN DAIRY DATA
advertisement
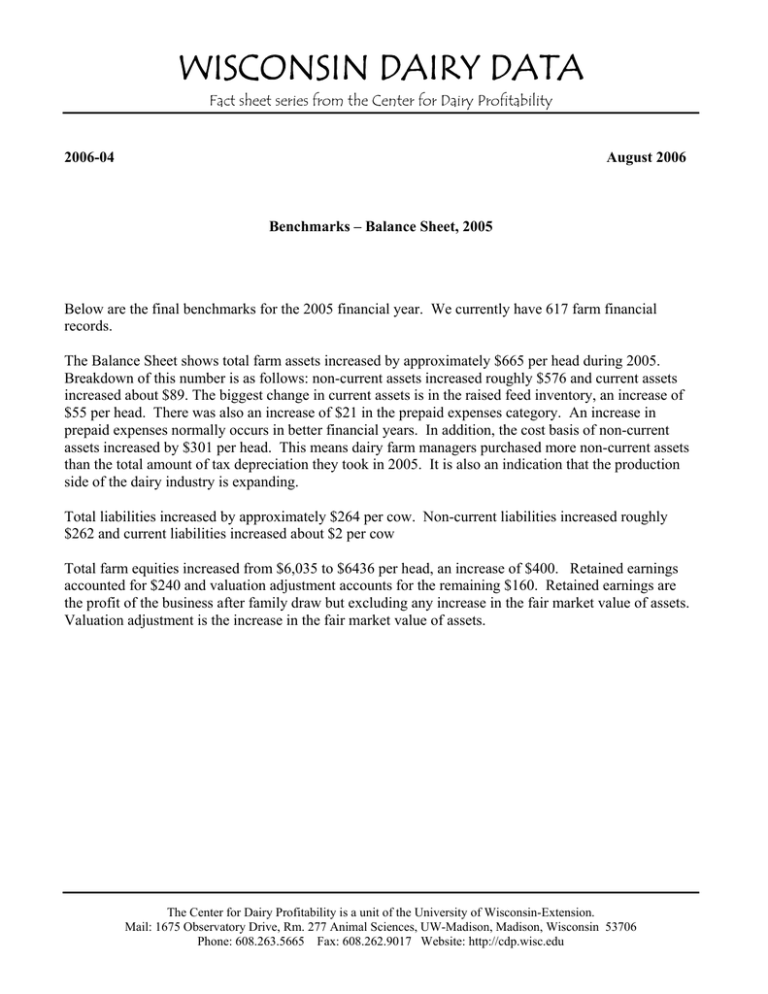
WISCONSIN DAIRY DATA Fact sheet series from the Center for Dairy Profitability 2006-04 August 2006 Benchmarks – Balance Sheet, 2005 Below are the final benchmarks for the 2005 financial year. We currently have 617 farm financial records. The Balance Sheet shows total farm assets increased by approximately $665 per head during 2005. Breakdown of this number is as follows: non-current assets increased roughly $576 and current assets increased about $89. The biggest change in current assets is in the raised feed inventory, an increase of $55 per head. There was also an increase of $21 in the prepaid expenses category. An increase in prepaid expenses normally occurs in better financial years. In addition, the cost basis of non-current assets increased by $301 per head. This means dairy farm managers purchased more non-current assets than the total amount of tax depreciation they took in 2005. It is also an indication that the production side of the dairy industry is expanding. Total liabilities increased by approximately $264 per cow. Non-current liabilities increased roughly $262 and current liabilities increased about $2 per cow Total farm equities increased from $6,035 to $6436 per head, an increase of $400. Retained earnings accounted for $240 and valuation adjustment accounts for the remaining $160. Retained earnings are the profit of the business after family draw but excluding any increase in the fair market value of assets. Valuation adjustment is the increase in the fair market value of assets. The Center for Dairy Profitability is a unit of the University of Wisconsin-Extension. Mail: 1675 Observatory Drive, Rm. 277 Animal Sciences, UW-Madison, Madison, Wisconsin 53706 Phone: 608.263.5665 Fax: 608.262.9017 Website: http://cdp.wisc.edu Balance Sheet Report Basis: per Head Beg. Dollars 2005 End Dollars Cost Basis Current Assets Cash Accounts Prepaid Expenses & Purchased Inventories Raised Feed Inventories Basis in Resale Livestock Purchased Accounts Receivable Market Livestock & Etc. Total Current Assets 174.35 112.74 575.89 2.13 2.15 7.02 172.55 133.90 631.32 13.24 3.22 8.83 874.28 963.06 1,872.16 488.20 1,457.68 1,717.75 2,693.10 184.35 1,987.62 480.16 1,573.24 1,964.75 2,770.68 213.21 367.25 684.65 1,210.47 1,136.04 132.28 357.42 713.43 1,407.30 1,196.58 156.99 8,413.24 8,989.67 3,530.70 3,831.72 9,287.52 9,952.72 46.34 135.85 111.55 43.78 139.51 112.92 293.75 296.21 1,194.08 1,764.34 0.00 1,211.68 2,009.09 0.00 2,958.42 3,220.77 3,252.17 3,516.98 675.04 49.17 717.52 47.18 Non-Current Assets Beg. Dollars Raised Breeding Livestock Purchased Breeding Livestock Machinery & Equipment Buildings Land & House Other Non-Current Assets Total Non-Current Assets Total Farm Assets End Dollars Current Liabilities Accounts Payable Current Portion of Non-Current Liabilities Other Current Liabilities Total Current Liabilities Non-Current Liabilities Intermediate Liabilities Long-Term Liabilities Contingent Liabilities Total Non-Current Liabilities Total Farm Liabilities Non-Farm Assets Non-Farm Liabilities Statement of Equities (Net Worth) Beginning Ending Change Contributed Capital 2.07 2.07 0.00 Retained Earnings 3,022.90 3,263.35 240.45 Valuation Adjustment 3,010.38 6,035.34 3,170.33 6,435.75 159.95 400.41 Total Farm Equities Non-Farm Equities 625.87 670.34 44.47 Total Equities 6,661.21 7,106.09 444.88 1 All current assets and raised breeding livestock are included in retained earnings
