Crop Processor Economics
Crop Processor Economics
Partial Budgeting Its Use - Corn Silage by
Gary Frank
1
April 1, 1999
Introduction
Partial budgets are ideal for analyzing small changes in a business. The main advantage of a partial budget is the small amount of data required to do an analysis of the change; when compared to doing a whole farm analysis. The main disadvantage is that there may be some interactive impacts on the farm business that a partial budget could overlook. However, given the access to the same interactive information, a partial budget will produce the same results as a whole farm analysis.
With this in mind, the impacts of using a crop processor on corn silage were analyzed using a partial budget. The key factors in the analysis were increased milk production/sales per cow, increased digestibility (of the corn silage), the feed ration change caused by the increased digestibility and the price of the crop processor.
Partial Budgeting Format
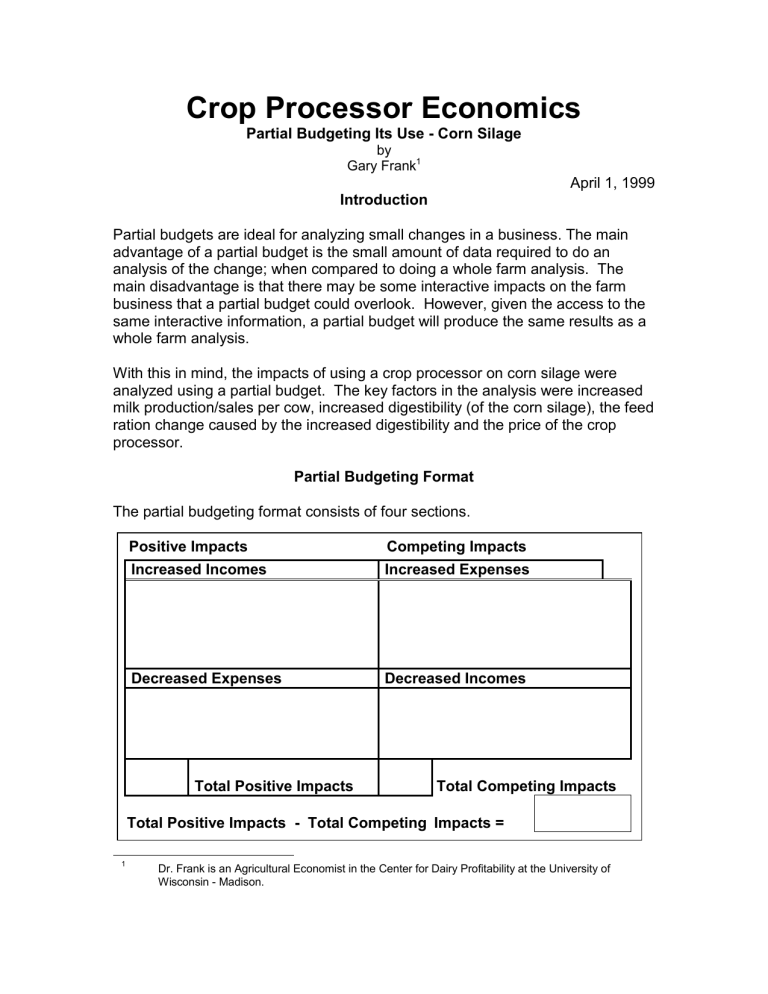
The partial budgeting format consists of four sections.
Positive Impacts
Increased Incomes
Competing Impacts
Increased Expenses
Decreased Expenses Decreased Incomes
Total Positive Impacts Total Competing Impacts
Total Positive Impacts - Total Competing Impacts =
1
Dr. Frank is an Agricultural Economist in the Center for Dairy Profitability at the University of
Wisconsin - Madison.
The two sections on the left side contain the increased incomes and decreased expenses. These are the “Positive Impacts” of the proposed change in the way a farm business produces output. On the right side of the form are the sections that will contain the increased expenses and reduced incomes. These are the
“Competing Impacts” of the proposed change.
The total positive impacts minus the total competing impacts equals the total effect of the proposed change on the profitability, or cash flow, of the farm business. Partial budgets can be constructed so that they analyze either the profitability of a proposed change or the proposed changes the effect on a business’s cash flow. Generally the analysis of profitability is constructed first.
Then if the proposed change is profitable, an analysis of cash flow is constructed.
There are two main differences between the profitability and the cash flow analysis.
When the profitability is analyzed, depreciation and interest is calculated on the required capital investment. They are usually calculated using the Capital
Recovery Charge (CRC) method shown in appendix A. They are entered unto the form as an increased expense and placed on one line labeled Capital
Recovery Charge. When the cash flow is analyzed the required loan payment is substituted for the CRC.
The other difference between the profitability and the cash flow analysis is in the treatment of labor costs. The profitability analysis treats labor as a scarce resource and asks for the “opportunity cost” of that labor. In other words, what is the highest return to that labor if it were used somewhere else on this farm. In the cash flow analysis, the actual cash wages that would be paid is substituted for the “opportunity cost”. This is implicitly assuming labor is not scarce and that you can always obtain additional help.
Base Values
Even though there are only four main factors in the analysis, several other pieces of information are necessary in order to do the analysis. The first of these are the price of
Prices
milk and
Milk Price $/Hundredweight $ 13.00
the prices
Corn Price $/Bushel $ 2.00
of some of
SBOM Price $/Ton $ 180.00
the feeds
Higher By-pass Protein Supplement $/Ton $ 250.00
fed. The prices of hay, haylage and corn silage is not required because the amount of hay, haylage and corn silage in the ration does not change dependent on whether or not a crop processor is used.
2
Amounts in Current Ration
Tons corn (or energy) fed per cow per year 3.45
Tons SBOM fed per cow per year 0.22
Tons by-pass protein fed per cow per year 0.17
Projected Changes in Above Values
Increased digestibility
Reduced SBOM feeding
Increased by-pass protein feeding
2%
5%
10%
Information about the current ration is needed. Also information is needed on the projected change in that ration when processed corn silage is fed.
The information required about the crop processor is as follows.
Investment Information
Price of crop processor $ 10,000
Useful Life of Crop Processor (Years) 10
Salvage Value (%)
Repairs, Insurance, Etc.
Increased energy to process corn silage
20%
5%
10%
Financing Information
Interest Rate 9%
Loan Length (Years) 5
Down Payment $ -
One of the critical values in this analysis is the improvement in milk sold per cow.
A starting value for this factor and some miscellaneous information are listed
Change in Milk Sold Information here.
Percentage Increase in Milk Sold per Cow 2.00%
Current Amount of Milk Sold per Cow (lbs) 22,000
Herd Size (Milking and Dry) 100
Custom Harvesting Charge
Additional Charge Per Wet Ton of Corn Silage $ 0.50
Miscellaneous Information
Percent of Forage Fed as Corn Silage
Increased Density in Bunker
40%
10%
Storage Costs Per Ton Forage of Dry Matter $ 40.00
3
Results
Based on the values chosen above purchasing a crop processor and using it on your corn silage is profitable. The positive impacts equal $6,691 per year. This includes $5,720 in increased milk sales. The competing impacts are $2,443 per year. Included in this is $1,427 in depreciation and interest on the investment.
This is labeled “Capital Recovery Charge”, the CRC. The analysis shows the profit to be $4,248 ($42 per cow per year) and the break-even increase in milk sold is 0.515 percent.
Analysis Table 1
The cash flow is not as promising, but it is still positive.
Analysis Table 2
4
It is positive by $2,824 and if all of this positive cash flow was used to service debt, the 9 percent, $10,000 loan could be paid off in 24.4 months. The breakeven increase in milk sold is 1.013 percent. This is nearly twice the level required to be profitable.
Of course an operation does not have to purchase an asset to reap its benefits.
Analysis Table 3 shows the cash flow partial budget if you were already custom hiring your corn silage chopping done and now pay the custom operator an extra
$0.50 per ton to run it through a crop processor. The cash flow is very favorable and the break-even increase in milk sold is only 0.054 percent.
Analysis Table 3
Now suppose you are doing your own chopping and do not want to purchase a crop processor, but want to have your corn silage processed. One option would be to leave your chopper in the shed and hire someone (with a crop processor) to harvest your corn silage. If the custom rate was $4.50 per ton, you would still make a profit and have a positive cash flow of $2,206 or $22 per cow. The breakeven increase in milk sold per cow is now 1.229 percent.
The level of profit should be even higher that the $22 per cow per year mentioned above. This is true because we did not consider (in the above paragraph) any of the variable cost savings your operation unquestionably will have by not chopping your own corn silage.
5
There has been some reference to the break-even percentage increase in milk sold per cow. Analysis Table 4 shows the profitability at various increases in milk sold and corn silage digestibility percentage levels. This table shows there is some impact on profitability from the digestibility percentage. Example: if the digestibility percentage changes from zero to four percent (at the 2.00% increase in milk sold) the profit changes from $3,982 to $4,514, an increase of $532.
However, the majority of the change in profit is caused by a change in the amount of milk sold. Example: if the milk sold percentage changes from zero to four percent (at the 2.00% increase in digestibility) the profit changes from a minus $1,471 to $9,968, an increase of $11,440.
Analysis Table 4
Analysis Table 5 shows the same range of information, but this table is in relation to the cash flow. The cash flow shows negative numbers earlier and they are larger.
Analysis Table 5
6
Analysis Table 6 shows the months required to repay the $10,000 loan. That loan can never be repaid (with the cash flow generated from this project), if the increase in milk production is zero percent.
Analysis Table 6
Summary
It appears that the use of a crop processor for crop silage will pay under most scenarios. Very low percentage increase milk sold will cause the investment to be unprofitable. However, even the no increase in milk sold scenario will prove to be profitable if you are already having your corn silage custom harvested and the extra cost for processing your corn silage is less than $0.30 per ton. This is assuming that there is an increase in digestibility of two percent.
Conclusions
There are many variables that can affect the profitability and/or the cash flow of a proposed investment in a crop processor. They are increased milk sold per cow, increased digestibility, milk price, loan terms, change in feed ration, price of purchased feeds and the price of the crop processor, to name just a few.
However, only a few of these have a significant impact on either the profitability or cash flow of the project, so a whole farm analysis is not necessary.
A partial budget analysis, with the accompanying sensitivity tables, provides the farm manager with the most detail and the least data demands. These details should help the farm manager make an informed decision.
The spreadsheet program used in this analysis is available on the Center for
Dairy Profitability’s web site. The site’s URL is:
www.wisc.edu\dairy-profit
Select “Decision Making Tools” from the menu and look for the “CropProc.xls” file. You need spreadsheet software Excel 7 to run this program.
7
Appendix A
&DSLWDO 5HFRYHU\ &KDUJH + &5& ,
&5& LV D SUR[\ IRU WKH RZQHUVKLS FRVWV RI DVVHWV ZLWK D SURGXFWLYH OLIH RI JUHDWHU WKDQ RQH \HDU 1 7KH
&5& WDNHV LQWR DFFRXQW WKH RZQHUVKLS FRVW RI DQ DVVHW DVVRFLDWHG ZLWK REVROHVFHQFH / GHSUHFLDWLRQ /
DQG RSSRUWXQLW\ LQWHUHVW RQ LWV UHPDLQLQJ YDOXH 1
7KH &5& LV GHWHUPLQHG XVLQJ D WZR SDUW IRUPXOD 1 7KH ILUVW SDUW LV UHFRYHULQJ + ZLWK LQWHUHVW , WKH
SRUWLRQ RI WKH DVVHW WKDW LV XVHG LQ WKH SURGXFWLRQ SURFHVV 1 7KH SRUWLRQ XVHG LQ WKH SURGXFWLRQ
SURFHVV LV WKH GLIIHUHQFH EHWZHHQ WKH SXUFKDVH SULFH + RU FRVW EDVLV , DQG WKH VDOYDJH YDOXH 1 7KLV
UHFRYHU\ LV VLPLODU WR ORDQ UHSD\PHQW 1 7KH IRUPXOD IRU FDOFXODWLQJ D ORDQ UHSD\PHQW IDFWRU LV VKRZQ
LQ WKH ER[ EHORZ 1
L
/RDQ 5HSD\PHQW )DFWRU + /5) ,
> 4 0 +4.
L , 0 Q @
:KHUH = L ,QWHUHVW 5DWH 3HU 3HULRG + DV D GHFLPDO ,
Q 1XPEHU RI 3HULRGV + XVXDOO\ LQ \HDUV RU PRQWKV ,
%\ VHWWLQJ WKH LQWHUHVW UDWH HTXDO WR WKH RSSRUWXQLW\ LQWHUHVW UDWH RQ WKH LQYHVWPHQW DQG WKH QXPEHU
RI SHULRGV HTXDO WR WKH XVHIXO OLIH RI WKH LQYHVWPHQW / WKH DSSURSULDWH /5) FDQ EH FDOFXODWHG 1
/5) WLPHV + FRVW RI DVVHW 0 LWV VDOYDJH YDOXH , SDUW 4 RI &5&
7KH VHFRQG SDUW RI WKH &5& LV WKH LQWHUHVW UDWH WLPHV WKH VDOYDJH YDOXH 1
,W LV VLPSOH LQWHUHVW RQ WKH LQYHVWPHQW * V VDOYDJH YDOXH 1
2SSRUWXQLW\ ,QWHUHVW 5DWH WLPHV DVVHW * V VDOYDJH YDOXH SDUW 5 RI &5&
6XPPLQJ SDUWV 4 DQG 5 FUHDWHV WKH DQQXDO &5& WR EH XVHG LQ SDUWLDO EXGJHWLQJ 1
([DPSOH = $ WUDFWRU LV SXUFKDVHG IRU '83/3331 ,W KDV D XVHIXO OLIH RI : \HDUV DQG D
VDOYDJH YDOXH RI '43/3331 7KH LQWHUHVW UDWH LV 45 SHUFHQW 1
145
3154<4
> 4 0 +4.145, 0: @
3154<4 [ +'83/3330'43/333, ';/:97 + 3DUW 4,
. 43/333 [ 145
&DSLWDO 5HFRYHU\ &KDUJH
'4/533 +
'</<97
3DUW 5,
8
9

