AbstractID: 3484 Title: What is the best way of measuring... CT data?
advertisement

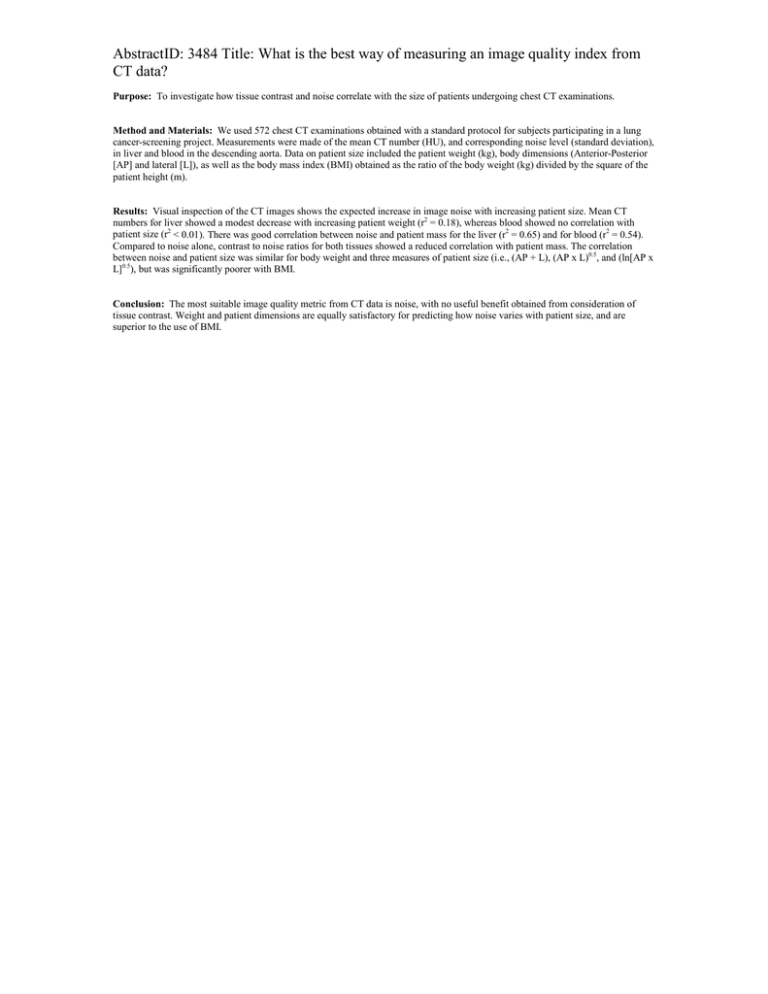
AbstractID: 3484 Title: What is the best way of measuring an image quality index from CT data? Purpose: To investigate how tissue contrast and noise correlate with the size of patients undergoing chest CT examinations. Method and Materials: We used 572 chest CT examinations obtained with a standard protocol for subjects participating in a lung cancer-screening project. Measurements were made of the mean CT number (HU), and corresponding noise level (standard deviation), in liver and blood in the descending aorta. Data on patient size included the patient weight (kg), body dimensions (Anterior-Posterior [AP] and lateral [L]), as well as the body mass index (BMI) obtained as the ratio of the body weight (kg) divided by the square of the patient height (m). Results: Visual inspection of the CT images shows the expected increase in image noise with increasing patient size. Mean CT numbers for liver showed a modest decrease with increasing patient weight (r2 = 0.18), whereas blood showed no correlation with patient size (r2 < 0.01). There was good correlation between noise and patient mass for the liver (r2 = 0.65) and for blood (r2 = 0.54). Compared to noise alone, contrast to noise ratios for both tissues showed a reduced correlation with patient mass. The correlation between noise and patient size was similar for body weight and three measures of patient size (i.e., (AP + L), (AP x L)0.5, and (ln[AP x L]0.5), but was significantly poorer with BMI. Conclusion: The most suitable image quality metric from CT data is noise, with no useful benefit obtained from consideration of tissue contrast. Weight and patient dimensions are equally satisfactory for predicting how noise varies with patient size, and are superior to the use of BMI.


