Figure 1. CHAPTER 1: SIMULATING BACTERIAL BIOFILMS
advertisement
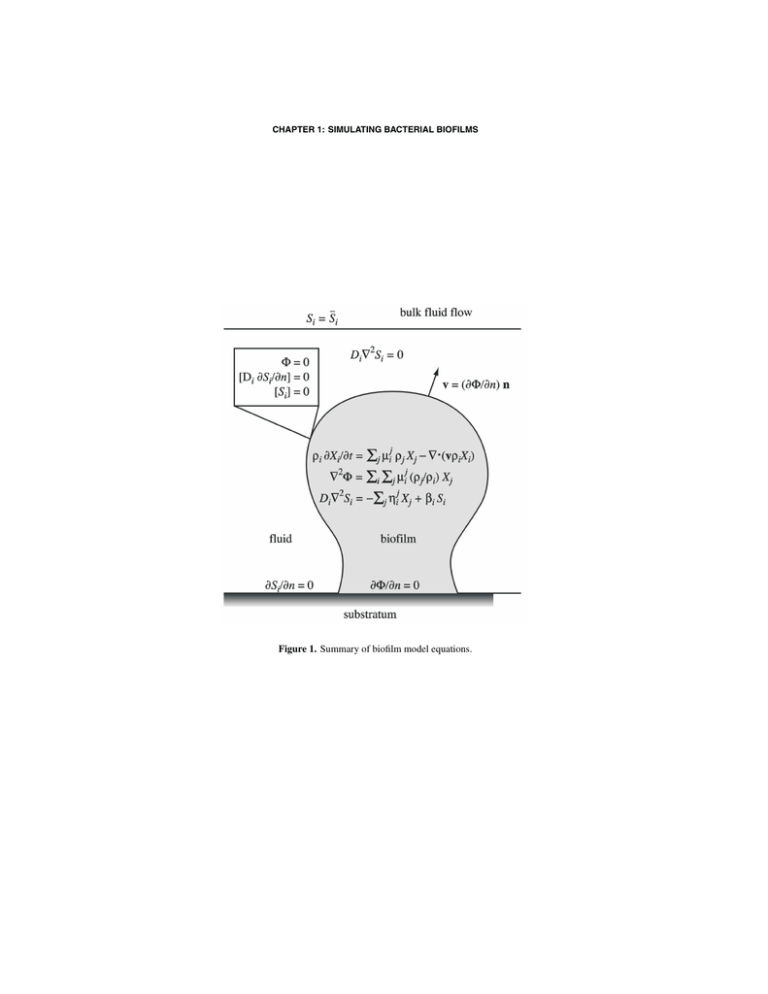
CHAPTER 1: SIMULATING BACTERIAL BIOFILMS Figure 1. Summary of biofilm model equations. DAVID L. CHOPP Figure 2. Sample solution of the Helmholtz equation on a circle using the X-FEM with exponential enrichment. Figure 3. Sample solution of substrate equation (9). CHAPTER 1: SIMULATING BACTERIAL BIOFILMS Figure 4. Sample solution of velocity potential equation (9). Figure 5. Illustration of where Xi values must be extended. The black dots are inside the biofilm, and the gray dots are where the extension values must be computed. DAVID L. CHOPP Figure 6. Sample portion of the mesh where a bicubic interpolation is used. Figure 7. Illustration of the sets A, T , D, associated with the fast marching method. This figure reprinted from [8] CHAPTER 1: SIMULATING BACTERIAL BIOFILMS Figure 8. Sample biofilm growth. Figure 9. Substrate concentration contours for the given biofilm shown with bold lines. Each contour line indicates half the concentration of the one above it as labeled. DAVID L. CHOPP Figure 10. Contours of the velocity potential, Φ, which also indicates the rate of substrate consumption. Consumption is concentrated at the tops of the tallest colonies. Figure 11. Graph of the volume fraction, X1 , of the bacteria in the biofilm. The composition is very uniform. Figure 12. Signal concentration contours in and around the biofilm just prior to quorumsensing.
