D E M O G R A P H I... O F R E N T A L ... Renter households are becoming more diverse
advertisement

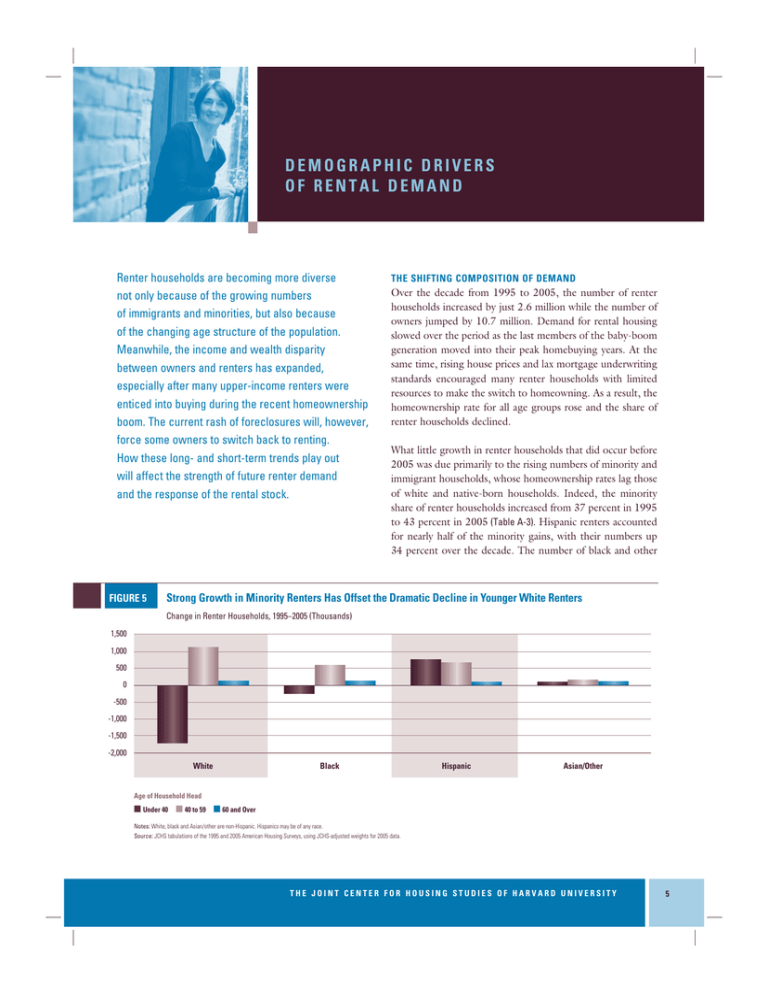
DEMOGRAPHIC DRIVERS OF RENTAL DEMAND Renter households are becoming more diverse not only because of the growing numbers of immigrants and minorities, but also because of the changing age structure of the population. Meanwhile, the income and wealth disparity between owners and renters has expanded, especially after many upper-income renters were enticed into buying during the recent homeownership boom. The current rash of foreclosures will, however, force some owners to switch back to renting. How these long- and short-term trends play out will affect the strength of future renter demand and the response of the rental stock. FIGURE 5 THE SHIFTING COMPOSITION OF DEMAND Over the decade from 1995 to 2005, the number of renter households increased by just 2.6 million while the number of owners jumped by 10.7 million. Demand for rental housing slowed over the period as the last members of the baby-boom generation moved into their peak homebuying years. At the same time, rising house prices and lax mortgage underwriting standards encouraged many renter households with limited resources to make the switch to homeowning. As a result, the homeownership rate for all age groups rose and the share of renter households declined. What little growth in renter households that did occur before 2005 was due primarily to the rising numbers of minority and immigrant households, whose homeownership rates lag those of white and native-born households. Indeed, the minority share of renter households increased from 37 percent in 1995 to 43 percent in 2005 (Table A-3). Hispanic renters accounted for nearly half of the minority gains, with their numbers up 34 percent over the decade. The number of black and other Strong Growth in Minority Renters Has Offset the Dramatic Decline in Younger White Renters Change in Renter Households, 1995–2005 (Thousands) 1,500 1,000 500 0 -500 -1,000 -1,500 -2,000 White Black Hispanic Asian/Other Age of Household Head ■ Under 40 ■ 40 to 59 ■ 60 and Over Notes: White, black and Asian/other are non-Hispanic. Hispanics may be of any race. Source: JCHS tabulations of the 1995 and 2005 American Housing Surveys, using JCHS-adjusted weights for 2005 data. THE JOINT CENTER FOR HOUSING STUDIES OF HARVARD UNIVERSITY 21 5 minority renter households rose more modestly, while that of white households fell by about 433,000. In part, these trends reflect the age structure of the immigrant and minority population. These groups are younger on average than whites because immigrants typically arrive in the United States as teenagers and young adults. Among renter households with heads aged 39 and under, the number of Hispanic renters increased by 775,000 from 1995 to 2005, even as the number of same-age white renters fell by 1.7 million and the number of black renters declined by 242,000 (Figure 5). Because of the sheer size of the baby-boom generation, the number of renter households aged 40 to 59 climbed 31 percent over this period, lifting the middle-aged share of renter households from 27 percent to 32 percent, with notable gains for whites and minorities alike. THE ROLE OF IMMIGRANTS Of the nearly 37 million renter households in 2005, one in six (6.1 million) were headed by an immigrant. Most foreignborn households rent their housing during their first several years in this country. For example, among the 1.6 million immigrants who had lived in the United States for five years or less in 2005, more than 80 percent were renters (Figure 6). But like native-born households, many foreign-born households eventually make the move to homeownership. Indeed, the median length of time that immigrants live in the United States before buying their first homes is about 11 years, and a little longer (14 years) for those who arrive before the age of 25. As a result, only one-third of the immigrants who came to the United States before 1990 remained renters in 2005. FIGURE 6 After being in the country for at least 15 years, the share of immigrant households that still rent nearly matches the share of same-aged native-born households. The decision to own or rent depends on a variety of demographic factors including income, age, and household composition, as well as supply factors such as home prices and location. Citizenship also appears to influence this choice, given that noncitizens are more than twice as likely as naturalized citizens to rent. This gap reflects the limited access that foreign-born noncitizens have to mortgage finance, as well as their tendency to be younger and to have lived in the United States for less time than foreign-born citizens. Foreign-born renters also differ from native-born renters in significant ways. For example, they are slightly more likely to have higher incomes, with only 37 percent of foreign-born renters in the bottom income quartile compared with 41 percent of native-born renters. Immigrants pay higher rents on average, largely because they tend to settle in some of the nation’s most expensive housing markets. In addition, they are far more likely than native-born individuals to live in the center cities of metro areas and much less likely to live in more affordable rural areas. HOUSING MOBILITY AND TENURE CHANGE Millions of households move in any given year. According to a recent Joint Center for Housing Studies analysis, some 20.4 million—or 19 percent of all households—reported a change of residence between 2003 and 2005. While not all households switch tenure when they move, many do. Over Recent Immigrants Buoy the Ranks of Renters Share of Households that Rented in 2005 90 80 70 60 50 40 30 20 10 0 Under 30 30 to 39 40 to 49 50 to 59 Age of Household Head ■ Arrived 2000–2005 ■ Arrived in 1990s ■ Arrived Before 1990 ■ Native Born Source: JCHS tabulations of the 2005 American Housing Survey, using JCHS-adjusted weights. 6 AMERICA’S RENTAL HOUSING—THE KEY TO A BALANCED NATIONAL POLICY 60 and Over this two-year period, 3.6 million renters became homeowners and 1.9 million owners became renters (Table A-4). At the same time, 4.7 million owners purchased other homes while more than 10.2 million renters moved to different rental units. In weighing the decision to move, households must assess the size, quality, and location of their housing options as well as the relative advantages of owning or renting. The transaction costs associated with renting a unit—usually just a matter of making a deposit—are much more modest than the realtor fees, mortgage brokerage costs, and downpayment requirements involved in buying a home. As a result, households with FIGURE 7a shorter expected stays are more likely to rent, while households with longer expected stays are more likely to buy given that they can spread the high transaction costs over a longer period. Younger households that anticipate major changes in education, employment, income, and marital status are therefore more apt to rent than otherwise similar households that have finished their schooling, settled down, and do not expect to move in the near future. Because owned units require higher monthly outlays and are usually larger and of better quality than rental units, higherincome renters are more likely than lower-income renters to Renters that Become Owners Have Higher Incomes… Share of Renter Households in 2003 That Owned in 2005 (Percent) 40 35 30 25 20 15 10 5 0 Under 30 30 to 39 40 to 49 50 to 59 60 and Over Bottom Age of Household Head Lower Middle Upper Middle Top Income Quartile Note: Income quartiles are equal fourths of all households sorted by pre-tax income. Source: JCHS tabulations of the 2003 and 2005 American Housing Survey, using JCHS-adjusted weights. FIGURE 7b …While Owners That Become Renters Are Much Younger and Have Lower Incomes Share of Owner Households in 2003 That Rented in 2005 (Percent) 6 5 4 3 2 1 0 Under 30 30 to 39 40 to 49 50 to 59 60 and Over Age of Household Head Bottom Lower Middle Upper Middle Top Income Quartile Note: Income quartiles are equal fourths of all households sorted by pre-tax income. Source: JCHS tabulations of the 2003 and 2005 American Housing Survey, using JCHS-adjusted weights. THE JOINT CENTER FOR HOUSING STUDIES OF HARVARD UNIVERSITY 21 7 switch to ownership (Figure 7a). Indeed, over one-third of renter households in the top income quartile in 2003 purchased homes in the ensuing two years, compared with less than 2.5 percent of renters in the bottom income quartile. Given the long-standing disparity in income and the lingering effects of racial discrimination, white renters are twice as likely as black renters to make the transition to owning. The number of owner households that switch to renting is also noteworthy. The reason most of these households cite for making such a move is a change in marital status, although other family/personal reasons, a new job or job transfer, and proximity to work or school are also common motivations. Some of these moves, however, are involuntary—especially if the owners faced foreclosure. While rising across the country, foreclosures appear to be highly concentrated in the lowestincome and minority communities. Consistent with these findings is the fact that homeowners in the bottom income quartile were three times more likely than those in the top income quartile to switch from owning to renting (Figure 7b). Today’s mortgage market woes will not only force many owners into the rental market, but also limit the homebuying opportunities for other lower-income renters. Another fallout from the crisis is the reported increase in renter evictions from foreclosed properties owned by absentee landlords and financed with subprime loans. At best, the rash of foreclosures will increase the number of households searching for rental units. At worst, it will add to the ranks of the homeless. FIGURE 8 Household Incomes of Renters Are Well Below Those of Owners Share of Households in Quartiles (Percent) 45 40 35 30 25 20 15 10 5 0 Bottom Lower Middle Upper Middle Income Quartile ■ Renter ■ Owner Note: Income quartiles are equal fourths of all households sorted by pre-tax income. Source: JCHS tabulations of the 2005 American Housing Survey, using JCHS-adjusted weights. 8 Top GROWING INCOME INEQUALITY The income and wealth gap between owners and renters continues to widen. According to the American Housing Survey, median renter income declined by 6 percent in real terms to $26,000 from 1995 to 2005, while median owner income increased by 8 percent to $55,000. By the end of that decade, some 41 percent of renters were in the lowest income quartile ($21,000 or less), compared with just 17 percent of owners (Figure 8). At the other end of the distribution, only 9 percent of renters were in the highest income quartile (over $76,000), compared with 33 percent of owners. The wide income gap reflects in part the steady movement of renters—and particularly white renters—into homeownership during the decade. Indeed, the number of white renters fell in all income quartiles except the lowest. While many minority households also bought homes during the boom, the number of minority renters in the lowest income quartile increased by over one million. In 2005, over 51 percent (3.6 million) of black and 39 percent (2.4 million) of Hispanic renters had incomes in the bottom income quartile. The latest available data from the Survey of Consumer Finance show that the inequality in wealth holdings of owners and renters has also increased. From 1995 to 2004, the surge in home prices and unusually favorable mortgage environment enabled most owners to accumulate home equity at a rapid clip. Over this same period, the median net wealth of owners (aggregate value of assets less debts) was up by 44 percent. In sharp contrast, the median net wealth of renters fell by 32 percent (Figure 9). Rapid home price appreciation helped to increase the disparity. By 2004, homeowners had aggregate net wealth of approximately $50 trillion, including nearly $12 trillion in home equity. Joint Center research indicates that growth in homeowner wealth for highest-income households also reflects gains in stocks and other financial assets, funded in part by equity cashed out either through home sales or refinancings. In contrast, income-constrained owners more typically used accumulated home equity to fund daily consumption needs rather than savings and investments. As a result, the disparity in wealth within the ranks of homeowners also grew in 1995–2004 as the median net wealth of highest-income owners nearly doubled while that of lowest-income owners fell. While lowest-quartile renter households did achieve some modest gains in net wealth between 1995 and 2004, this category includes many households who switched from owning to renting and took with them home equity acquired over the AMERICA’S RENTAL HOUSING—THE KEY TO A BALANCED NATIONAL POLICY period of rapid price appreciation. Even so, the median wealth holdings of owners in 2004 was 45 times the median wealth holdings of renters. It is important to note that these net wealth estimates predate the recent housing market turmoil when millions of homeowners began to see substantial losses of home equity. At this point, it is impossible to predict how long it will take for prices to stabilize and then begin to rise again. But even in the extremely unlikely case that homeowner wealth returns to 1995 levels and renter wealth remains unscathed, median homeowner wealth would still be as much as 30 times higher than median renter wealth. THE OUTLOOK If foreclosures continue to rise, renter household growth could return to levels not seen in a decade. This is already the case in those regions and for those groups that have experienced declines in homeownership rates for several years. For example, given that foreclosures in the industrial Midwest have been climbing since 1996, it stands to reason that renters now constitute a growing share of households in that region. In fact, the Housing Vacancy Survey indicates that the number of renter households in the Midwest was up some 10.4 FIGURE 9 percent from 2004 to 2007, nearly double the increase in the rest of the nation. Similarly, the homeownership rate for black households has declined more or less steadily since 2004 and growth in the number of black renters has accelerated. Now that the homeownership rate for whites also appears to be declining and that for Hispanics has leveled off, the numbers of renter households in these groups are likely to increase as well. Looking beyond the immediate housing market turmoil, there is reason to believe that the growth of renter households will again slow early in the next decade. Based on most likely assumptions about population growth, household formation rates, and continued immigration, the Joint Center estimates that demographic factors alone will add 14.6 million households on net between 2005 and 2015. Growth of this magnitude will not only help to absorb the oversupply in both owner and renter markets, but also begin to stabilize housing prices and restore gains in homeownership. Renter Wealth Lags Far Behind Owner Wealth Median Net Wealth (2004 dollars) Tenure and Income Quartile Percent Change 1995 2004 1995–2004 79,160 75,850 -4.2 Lower Middle 99,473 118,300 18.9 Upper Middle 107,598 161,000 49.6 Top 237,910 453,600 90.7 Total 127,813 184,560 44.4 Bottom 1,231 1,830 48.7 Lower Middle 6,771 5,400 -20.2 Owner Bottom Renter Upper Middle 20,436 19,720 -3.5 Top 62,417 60,500 -3.1 Total 5,934 4,050 -31.7 Notes: Income quartiles are equal fourths of all households sorted by pre-tax income. Dollar values are adjusted for inflation by the CPI-UX for all items. Source: Joint Center tabulations of the 1995 and 2004 Surveys of Consumer Finance. THE JOINT CENTER FOR HOUSING STUDIES OF HARVARD UNIVERSITY 21 9


