Matching Teaching Strategies with New Technology: Practical Theories for Course Redesign
advertisement
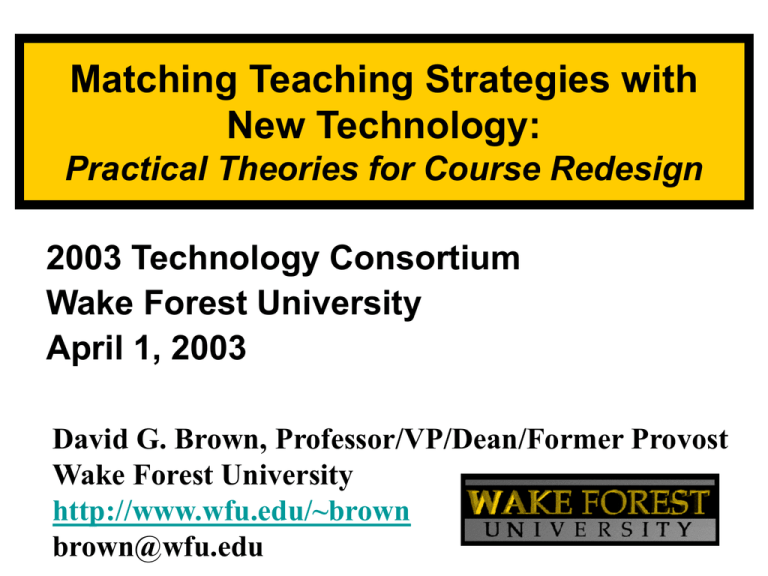
Matching Teaching Strategies with New Technology: Practical Theories for Course Redesign 2003 Technology Consortium Wake Forest University April 1, 2003 David G. Brown, Professor/VP/Dean/Former Provost Wake Forest University http://www.wfu.edu/~brown brown@wfu.edu 2 FIRST YEAR SEMINAR The Economists’ Way of Thinking: • To understand a liberal arts education as an opportunity to study with professors who think by their own set of concepts • To learn how to apply economic concepts • To learn how to work collaboratively • To learn computer skills • To improve writing and speaking Students = 15 All Freshmen Required Course Before Class During Class. After Class 3 Proven Teaching Strategies 21st Century 1. Communication-Interaction 2. Collaboration-Teams 3. Controversy-Debate 4. Customization-Diversity 5. Consultants-Adjuncts www.ankerpub.com/books/brown.html www.ablongman.com/professional/catalog/academic/product/1,4096,0205355803,00.html 4 The 21st Century Context 21st Century • • • • • • • Customized. Interactive. Collaborative. Student-Centered Curriculum Teaching Collaborations & Teams Chunks, not Textbook Gold Standard = Hybrid (80-20 & 20-80) Engaged Learning On Line Only for New Buyers 5 Implications for You and Me • • • • • • Must teach on assumption of ubiquity Must insist on open library & network KISS--- low hanging fruit Open Culture of Sharing Workshops around strategy, not theory More emphasis upon Teaching 6 Emphasis Upon Teaching in hiring, promotion, tenure, and prestige • • • • • • More options More evidence More collaboration More student awareness More T-L Centers More publication outlets 7 Low Hanging Fruit [within the constraints of time & money] 21st Century 1. URLs 2. Email 3. Course Management System WebCT and/or Blackboard Better 85% Some Use Vs 5% Heavy Use 8 THE WAKE FOREST PLAN IBM A30, Pentium III, 1.13GHz Processor, 30GB Hardrive, 384 MB RAM 15”ActMatrix Screen, CD-RW/DVD, Floppy, 56k modem, 16MB Video Ram, 10/100 Ethernet, USB&Serial&Parellel&Infrared Ports • • • • • • • IBM Laptops for all Printers for all New Every 2 Years Own @ Graduation 31,000 Connections Standard Software Start 1995, 4 Year Phase In • +15% Tuition Standard Load Includes— MS Office, Dreamweaver, SPSS, Maple, Acrobat, Photoshop, Shockwave, Flash, Net Meeting, Real Producer & Player, Media Player, Windows XP Moviemaker, Apple QuickTime, Netscape & Explorer, Netscape Calendar & Communicator, Windows XP Professional 9 CONCEPTS BEHIND PLAN • • • • Students First 2 Layers: Threshold + Rapid Change Communicate/Access (Not Present/Analyze) • Standardization • Academic Freedom • Nomadic Learners ICCEL -- Wake Forest University, 2003 10 Impact of the Plan for the Class of 2000, No. of Items with Significant Differences in Wake Forest Student Responses, CSEQ Questionnaire 2002 Survey versus 1998 Survey Computer Usage………………..…2002 wins 6-2 Information Fluency………….…...2002 wins 5-1 Integration of Knowledge………..2002 wins 3-0 Specific Knowledge & Skills…….2002 wins 6-1 Interpersonal Communication…..2002 wins 8-0 Co-Curricular Participation……...2002 wins 5-0 Source: Ross Griffith, Wake Forest Univ. Institutional Research Office. http://www.wfu.edu/administration/ir/docs/CSEQComparison2002.pdf 11 Computers allow people---• to belong to more communities • to be more actively engaged in each community • with more people • over more miles • for more months and years • TO BE MORE COLLABORATIVE ICCEL -- Wake Forest University, 2003 12 With Ubiquity--The Culture Changes • Mentality shifts-- like from public phone to personal phone. • Teaching Assumptions shift-- like from books in the public library to everyone owns a copy of his/her own. • Timelines shift-- like from “our class meets MWF” to “we see each other all the time and MWF we meet together” • Students’ sense of access shifts-- like from “maybe I can get that book in the library” to “I have that book in my library.” • Relationships shift-- like from a family living in many different states to all family members living in the same town ICCEL -- Wake Forest University, 2003 Progress Toward Realizing the Full Learning Potential of Ubquitous Computing-- in Increments of Equipment [Study Chart from Bottom to Top] 0% 25 % 50 % 13 75 % 100 % Add Handhelds connected everywhere wirelessly Add 5% Add Laptops connected everywhere wirelessly Add 14 % Add all with wireless connectivity in classroom Add Add all with wired connectivity in classroom Add 1% 5% Add all with connectivity from personally owned computers Add 45 % Add all with access to public lab computers Instructor only computer with connectivity & classroom projection Add 20 % 10 % [Interpretation of chart: 10% of the value is achieved when the instructor only (bottom line) has a computer. Another 20% is added, for a total of 30%, when all students can get to computers in a public lab. … 100% of the value of ubiquity is achieved when everyone has access everywhere.] 14 Comments and Questions Now!---On your 3x5 card Write one useful thing you’ve learned from this session! Pass the card to your right! Let’s Talk! David G. Brown Wake Forest University Winston-Salem, NC 27109, 336-758-4878 email: brown@wfu.edu http//:www.wfu.edu/~brown fax: 336-758-5012 Wake Forest University, 2003
