INCREASING BELT CONVEYOR RELIABILITY THROUGH “VIRTUAL PROTOTYPING”
advertisement
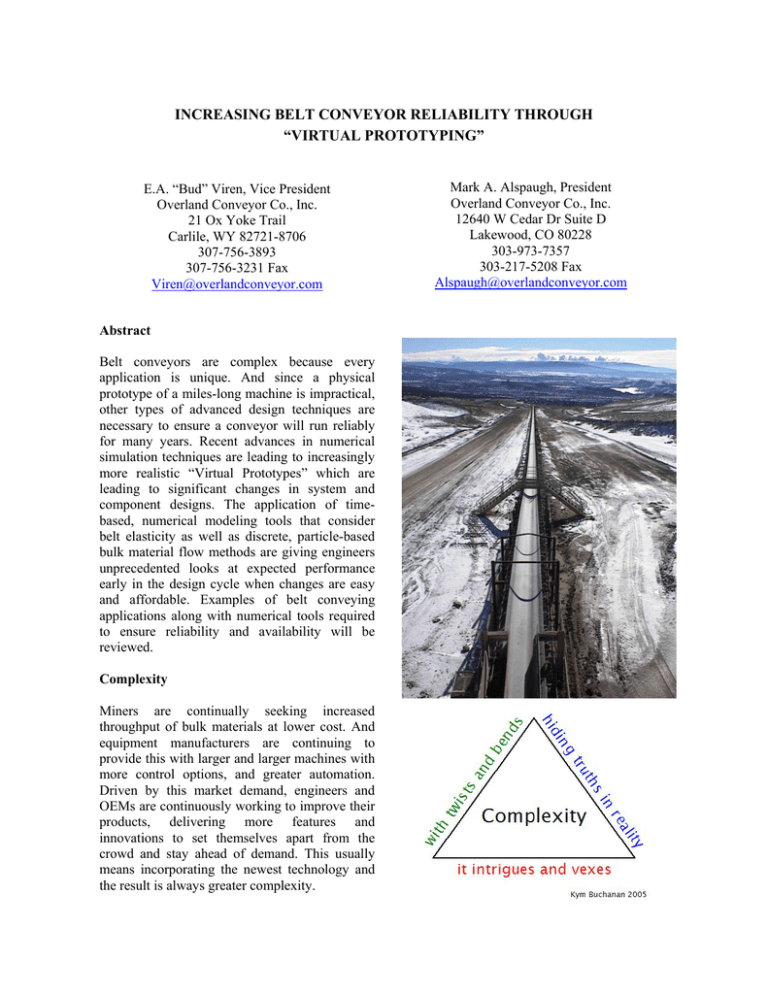
INCREASING BELT CONVEYOR RELIABILITY THROUGH “VIRTUAL PROTOTYPING” E.A. “Bud” Viren, Vice President Overland Conveyor Co., Inc. 21 Ox Yoke Trail Carlile, WY 82721-8706 307-756-3893 307-756-3231 Fax Viren@overlandconveyor.com Abstract Belt conveyors are complex because every application is unique. And since a physical prototype of a miles-long machine is impractical, other types of advanced design techniques are necessary to ensure a conveyor will run reliably for many years. Recent advances in numerical simulation techniques are leading to increasingly more realistic “Virtual Prototypes” which are leading to significant changes in system and component designs. The application of timebased, numerical modeling tools that consider belt elasticity as well as discrete, particle-based bulk material flow methods are giving engineers unprecedented looks at expected performance early in the design cycle when changes are easy and affordable. Examples of belt conveying applications along with numerical tools required to ensure reliability and availability will be reviewed. Complexity Miners are continually seeking increased throughput of bulk materials at lower cost. And equipment manufacturers are continuing to provide this with larger and larger machines with more control options, and greater automation. Driven by this market demand, engineers and OEMs are continuously working to improve their products, delivering more features and innovations to set themselves apart from the crowd and stay ahead of demand. This usually means incorporating the newest technology and the result is always greater complexity. Mark A. Alspaugh, President Overland Conveyor Co., Inc. 12640 W Cedar Dr Suite D Lakewood, CO 80228 303-973-7357 303-217-5208 Fax Alspaugh@overlandconveyor.com In a recent survey of product designers and engineers published by a prominent magazine, 42% identified design and product complexity as the most important issue they face; well ahead of time-to-market pressures (13%), competitive pressure (12%), and cost reduction (11%). And engineering is in the midst of a continuing explosion of complexity. All types of products including cars, computers, and even toasters are more complex than they were ten years ago. But greater complexity brings both new benefits and new problems. For example, new cars can include amazing technology that can tell you where you are and where you should be, but when they break down, they do so in strange new ways that most drivers don’t understand. Unfortunately, everyone agrees these trends will not be changing any time soon. And all the new wonderful technology in the world is worthless if we cannot produce reliable equipment. Therefore, the implications of this “complexification” require we develop new techniques and strategies for engineering complex systems that deal with these problems. Design “Testing” Today’s huge mining machinery share another common characteristic in that final assembly occurs at the mine. These machines are too big to be assembled and “tested” before hand. Although sub-systems and components are tested, the assembled machine (system) is “commissioned” and expected to perform almost immediately. Overland belt conveyor engineers face an even more difficult task as most every major conveyance systems is totally unique in system design. And today, the many components that must all interact together properly for the conveyor system to function are often manufactured all over the world and only interface during commissioning. Reliability and Availability Belt conveyors are used in mining because they are an economical way to move bulk materials over distances up to many miles. But because a conveyor delivers a very small amount of material over long periods of time, it is essential they operate efficiently with maximum availability and minimum downtime. Unlike a truck or train that delivers large loads intermittently, a conveyor must deliver a small, steady stream of material continually. Therefore, reliable and available equipment is absolutely essential in conveyor system design. System Availability System availability is calculated by modeling the system as an interconnection of parts in series and parallel. • If failure of a part leads to the combination of parts becoming inoperable, the two parts are considered to be operating in series. This is typical of a conveyor or series of conveyors as a single part failure will stop the whole system and stop throughput. • If failure of a part leads to another part taking over the operations of the failed part, the two parts are considered to be operating in parallel. This would be typical of a fleet of trucks. Availability in Parallel As stated above, two parts are considered to be operating in parallel if the combination is considered failed when both parts fail. The combined system is operational if either is available. From this it follows that the combined availability is 1 - (both parts are unavailable). The combined availability is shown by the equation below: The implications of the above equation are that the combined availability of two components in parallel is always much higher than the availability of its individual components. combination considering the same nominal 6000 hours of operation a year. Component Consider the system in the figure above. Two instances of Part X are connected in parallel. The table below shows the availability and downtime for individual components and the parallel combination considering a nominal 6000 hours of operation a year. Component X Combined System Availability 95% 99.75% Downtime 16 days/year 1 day/year From the above table it is clear that even though a very low availability Part X was used, the overall availability of the system is much higher. Thus, parallel operation provides a very powerful mechanism for making a highly reliable system from low reliability. Availability in Series As stated above, two parts X and Y are considered to be operating in series if failure of either of the parts results in failure of the combination. The combined system is operational only if both Part X and Part Y are available. From this it follows that the combined availability is a product of the availability of the two parts. The combined availability is shown by the equation below: The implications of the above equation are that the combined availability of two components in series is always lower than the availability of its individual components. Consider the system in the figure above. Part X and Y are connected in series. The table below shows the availability and downtime for individual components and the series Availability Downtime X 95% 16 days/year Y Combined System 99% 94% 3 days/year 19 days/year From the above table, it is clear that even though a very high availability Part Y was used, the overall availability of the system was pulled down by the low availability of Part X. This just proves the saying that a chain is as strong as the weakest link. More specifically, a chain is weaker than the weakest link. Therefore designing a highly reliable conveyor system requires the elimination of all weak links. Failures Equipment failures over equipment life is sometimes characterized by a bath tub curve (example curve is shown below). The chance of a hardware failure is high during the initial life of the machine. The failure rate during the rated useful life of the product is fairly low. Once the end of the life is reached, failure rates increase again. Most owners understand the small rate of failure during the “Useful Life” phase which is why stores of critical spare parts are maintained. And most of us understand that failures increase near the “End of Life” (which usually defines the “End of Life”). But it is much harder for many to understand the reasons for a high “Infant Mortality.” Because these huge machines cost a lot of money, they are expected to perform accordingly. Yet “Infant Mortality” can still be high and frustrating because management is always anxious to see results of their huge investment. These failures can be attributed to the following causes: 1. Manufacturing- This type of failure can be attributed to problems such as poor welding, improper factory lubrication, contamination, etc. These failures should NOT be present in new components leaving a factory but many do exist as normally only representative components receive complete QA testing and fewer will actually find their way to the manufacturer’s lab for destructive life testing. Idlers are good examples, as statistically a few bearings will always fail in the first several hours of operation just due to the shear volume of the product (bearings). Although these types of failures deserve attention and scrutiny, this subject is beyond the scope of this paper. 2. Design- This class of failure takes place due to inherent design flaws in a component or in the system. In a welldesigned system this class of failure should make a very small contribution to the total number of failures but it is arguable that design flaws are the most common problems operators face. One reason is system design methods can vary widely from company to company and from engineer to engineer, and defining a “well designed system” is very difficult. And if a component fails, it is not always clear if the component design or the system design is to blame. The complex relationships between the system and the components are the main topic of this paper. The System vs. Components The definition of a system is “a set of interrelated components working together toward some common purpose.” 1. The properties and behavior of each component of the system affects the performance of the whole system. 2. The performance of each component of the system depends on the properties and behavior of the system as a whole. This concept that component performance depends on the whole system design provides a troubling concern for all manufacturers as their products can be affected by conditions outside their control. Are the actual operating conditions their products will be subjected to actually as they are represented by the system designer? There are many components specialists in rubber, bearings, power, motors, gearing, lubrication, controls, et cetera, that must be knowledgeable in their respective fields for the system to work. But seldom are these individual specialists knowledgeable of the system in which their expertise in used. The field of systems engineering was established and is growing out the need for the system management function in the design of complex machines. The influence of the systems engineer is critical during the early conceptual stages of the design process when the emphasis is on the optimization of the system and not the individual components. At that point, the cost of identifying and correcting unreliability is much less costly than correcting during construction, commissioning, or burn in. The systems engineer who is responsible for ensuring all the components are working together is critical to the final product. Since a system “test” is not possible, the systems engineer must usually rely on mathematical models to ensure the machine will perform as expected. The quality of the mathematical tools used is directly related to long-term performance and reliability. These mathematical design tools are now progressing from classical stress, strain analytical tools which are necessary on a micro scale to time-based, simulation tools that are necessary to look at a dynamic system on a macro scale. All of these simulation techniques are sometimes included in a general category called “Virtual Prototyping.” “Virtual Prototyping” Approach to Design Greater complexity of all components increases the amount of knowledge, information, and communication required to optimize the design. At each step in design development the detailed options multiply and interact, and they all have to be evaluated iteratively against the product performance, quality, and manufacturing cost requirements. If designers and engineers are to cope with these conflicting demands, they need a new approach to the design process, capable of delivering not just higher design and engineering productivity, but a design environment that actually supports and promotes innovation. Virtual prototyping (or “digital mock-up”) has been used for years in the automotive and aerospace industries where it is recognized as the only way to manage the complexity inherent in their products and their engineering business networks. Today, this same approach is being adopted in many aspects of belt conveyance. Figure 9 The advantages of 3D solid modeling (Figure 9) are fairly well understood and proven in practice. Surprisingly, given the obvious advantages, there are still many engineering companies who have not adopted 3D technology. One reason may be a lingering belief that 2D and 3D CAD are in some way alternative methods of computerized drawing, which they are not. Modern 3D CAD systems are comprehensive product design environments in which 3D solid modeling and 2D drawing are completely integrated. The designer can move in and out of each mode seamlessly at any time, selecting the right tool for the task at hand. 2D drawings are often helpful for layout and as input to 3D models, and are still the preferred communication medium for many customers and suppliers. From the system engineering viewpoint, an additional benefit of designing in 3D is the opportunity to migrate to performance simulation. Today, numerical simulation methods exist which allow designers to “test” their design prior to fabrication. Numerical simulation is the discipline of designing a model of an actual physical system, executing the model on a computer, and analyzing the results. Simulation embodies the principle of “learning by doing.” To understand reality and all of its complexity, we build artificial objects in the computer and dynamically watch the interactions. As to innovation, it’s all about having time to think, to gather information, and to explore alternatives. The quality of any design is to a large extent proportional to the amount of time the designer can afford to spend finding technical and product data, trying out ideas, exploring different configurations, and sharing the current state of design development with collaborators. Performance simulations enable the designer to “experiment” with alternative ideas and configurations without which innovation is stifled. The major increase in productivity that is achieved by the virtual prototyping approach frees up time for thinking. And, by the nature of the process, it actually promotes creativity and optimization. Transfer Points Probably the most significant example of the “virtual prototyping” approach to conveyor design over the last 5 years has been in the design of belt conveyor transfer points. Many of the most difficult problems associated with belt conveyors center around loading and unloading. The transfer chute is often sited as the highest maintenance area of the conveyor and many significant production risks are centered here: 1. 2. 3. 4. Plugging Belt and chute damage and abrasion Material degradation Dust (Figure 10) 5. Material spillage (Figure 11) Figure 10 each body and/or particle at discrete points in time during the analysis. In the analysis, particles are modeled as shaped bodies. The bodies can interact with each other, with transfer boundary surfaces and with moving rubber conveyor belt surfaces. The contact/impact phenomena between the interacting bodies are modeled with a contact force law which has components defined in the normal and shear directions as well as rotation. The normal contact force component is generated with a linear elastic restoring component and a viscous damping term to simulate the energy loss in a normal collision. The linear elastic component is modeled with a spring whose coefficient is based upon the normal stiffness of the contact bodies and the normal viscous damper coefficient is defined in terms of an equivalent coefficient of restitution (Figure 12). Figure 11 In the past, no analytical tools have been available to the design engineer so trial-and-error and experience were the only design methods available. This has changed dramatically. Figure 12 The Discrete Element Method (DEM) is a family of numerical modeling techniques and equations specifically designed to solve problems in engineering and applied science that exhibit gross discontinuous mechanical behavior such as bulk material flow. It should be noted that problems dominated by discontinuum behavior cannot be simulated with conventional continuum-based computer modeling methods such as finite element analysis, finite difference procedures, and/or even computational fluid dynamics (CFD). The DEM explicitly models the dynamic motion and mechanical interactions of each body or particle in the physical problem throughout a simulation and provides a detailed description of the positions, velocities, and forces acting on Figure 13 Figure 13 shows multiple particles falling through two transfer chutes. The colors of the particles in the visualization represent their velocity. The RED color is zero velocity while BLUE is the highest velocity. Perhaps the greatest benefit that can be derived from the use of these tools is the feeling an experienced engineer can develop by visualizing performance prior to building. From this feel, the designer can arrange the components in order to eliminate unwanted behavior. Other quantitative data can also be captured including impact and shear forces (wear) on the belt or chute walls. Due to the expanded use of Powder River Basin coal in power generation plants today, dust and dust control methods have become increasing important considerations in plant operation. One of the most likely sources of airborne dust is conveyor-to-conveyor transfers. Induced airflow caused by frictional drag of a falling or sliding material stream is an airborne dust producing mechanism; therefore control of the material stream is of particular importance. The use of a DEM numerical simulation technique to model coal flow has become an important design tool in this area over the last 4 years. 2. Maximum forces on pulleys 3. Minimum belt stresses and material spillage 4. Take-up force requirements 5. Take-up travel and speed requirements 6. Drive slip 7. Breakaway torque 8. Holdback torque 9. Load sharing between multiple drives 10. Material stability on an incline Therefore during these critical conditions of stopping and starting, it is important a mathematical model of the belt conveyor that takes elasticity into account be used. Proper analysis and simulation of these state changes (rest to motion and motion to rest) will have significant impact on system reliability. A model of the complete conveyor system can be achieved by dividing the conveyor into a series of finite elements. Each element has a mass and rheological spring as illustrated in Figure 14. Example 2- Dynamic Starting and Stopping Simulation Another example of advanced simulation methods involves starting and stopping a belt conveyor. When performing starting and stopping calculations per CEMA or DIN 22101 (static analysis), it is assumed all masses are accelerated at the same time and rate; in other words, the belt is a rigid body (non-elastic). In reality, drive torque transmitted to the belt via the drive pulley creates a stress wave which starts the belt moving gradually as the wave propagates along the belt. Stress variations along the belt (and therefore elastic stretch of the belt) are caused by these longitudinal waves dampened by resistances to motion as described above. i Many publications since 1959 have documented that neglecting belt elasticity in high capacity and/or long-length conveyors during stopping and starting can lead to incorrect selection of the belting, drives, take-up, etc. Failure to include transient response to elasticity can result in inaccurate prediction of: 1. Maximum belt stresses Figure 14 Many methods of analyzing a belt’s physical behavior as a rheological spring have been studied and various techniques have been used. An appropriate model needs to address: 1. Elastic modulus of the belt longitudinal tensile member. 2. Resistances to motion which are velocity dependent (i.e., idlers). 3. Viscoelastic losses due to rubber-idler indentation. 4. Apparent belt modulus changes due to belt sag between idlers. Since the mathematics necessary to solve these dynamic problems are very complex, it is not the goal of this presentation to detail the theoretical basis of dynamic analysis. Rather, the purpose is to stress that more accurate simulation techniques lead to better design. The importance of dynamic analysis taking belt elasticity into account is vital in order to go from an acceptable design to a very good one. As an example, a 700-foot-long conveyor with 75 feet of lift, carried 1500 tph of coal at 600 fpm has been analyzed. Using static methods per CEMA 6th Editionii, an acceptable design was developed. A diagram of running (black), starting (blue) and stopping (pink) belt tensions is shown (Figure 15). Figure 16 Figure 17 Starting simulations were also performed using three different starting types (Figure 18): Figure 15 When using the more advanced dynamic simulations, a stopping analysis shows: 1. The belt tension in the concave vertical curve drops very low (Figure 16). 2. The belt sag in the concave vertical curve between the idlers gets very large, indicating some material slippage would most likely occur (Figure 17). 1. The motor is started across-the-line (4second start time). 2. A “soft start” is inserted between the motor and pulley (10-second start time). 3. A controllable drive type with velocity feedback control (20-second start time). The results indicate some type of starting control is necessary to: 1. Prevent drive slip. 2. Prevent excessive belt sag. Across-the-Line Soft Start Controlled Start Belt Velocity vs. Time T1/T2 Ratio vs. Drive Pulley Slip Limit Belt Sag between Idlers Drive Horsepower vs. Time Take-up Carriage Displacement and Velocity vs. Time Figure 18 Both of these problems are quite common and are often not properly identified. Symptoms of these conditions might be: 1. 2. 3. 4. 5. Short belt life. Belt splice failures. Lagging wear. Pulley failures. Material spillage. In addition to obvious problems, the horsepower plots and take-up carriage plots show graphically how all drive train components and take-up components should provide more reliable service when the start times are increased. Reliability vs. Cost There is no doubt that increased reliability carries a cost. However, with today’s pressures to automate coupled with modern management systems capable of quantifying the cost of downtime, it is becoming easier to justify higher upfront costs in order to reduce future costs (Figure 19) and realize long term efficiencies. The key is to properly invest in applicable design and “virtual prototyping: techniques early enough to make the best design and component selection decisions. If these tools are used early in the process, the associated costs can be easily justified. Conclusions Belt conveyors are complex machines and are becoming increasingly so as more options become available from traditional sources as well as from new international players. Sorting through this complexity has become one of the most challenging problems of project managers and engineers. Advances in computer hardware and software are allowing engineers and designers to get an unprecedented feel for belt conveyor performance via “virtual prototyping” techniques which provides decision makers with additional and improved information during the design process. Improved design and engineering will translate into longerlasting components and reduced problems, thereby increasing system reliability and reducing maintenance costs. Although many of these design techniques may not yet be considered “mainstream,” users are rapidly learning to specify them during the design process. The added cost during the preliminary engineering phase is small when compared to the cost of fixing design inadequacies during and after commissioning. i O’Donovan, E.J., “Dynamic Analysis- Benefits for all Conveyors,” Conveyor Belt Engineering for the Coal and Mineral Mining Industries, Society for Mining, Metallurgy and Exploration, Inc., 1993. ii “Belt Conveyors for Bulk Materials,” Conveyor Equipment Manufacturers Association, 6th Edition, 2005 Figure 19
