vii i TABLE OF CONTENTS
advertisement
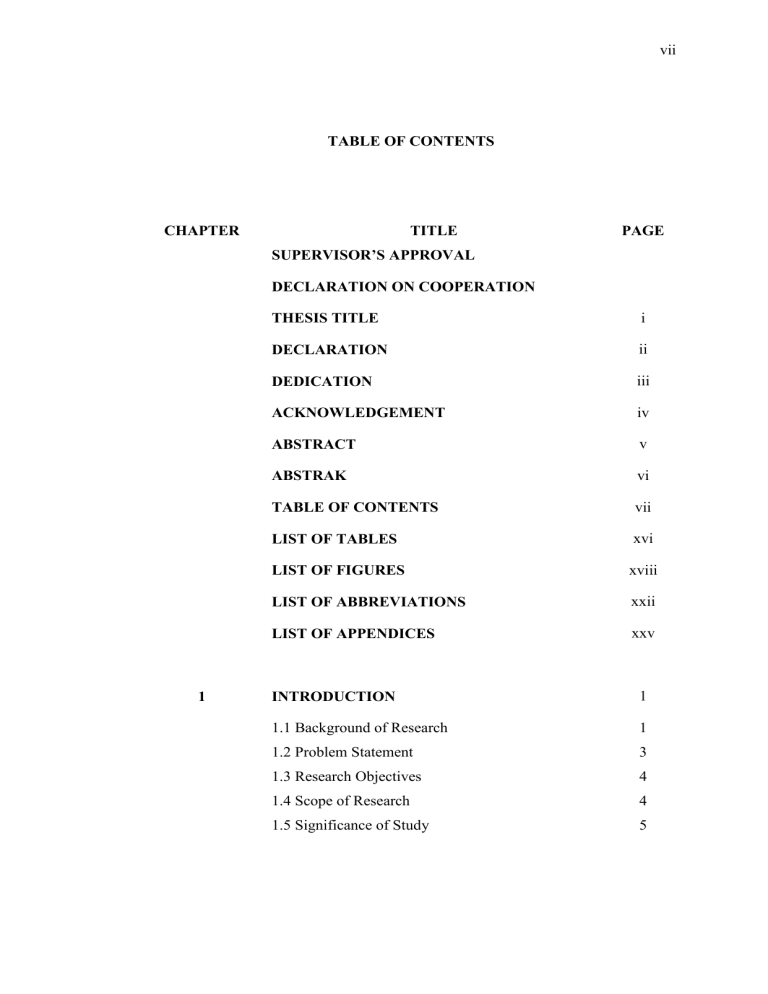
vii TABLE OF CONTENTS CHAPTER TITLE PAGE SUPERVISOR’S APPROVAL DECLARATION ON COOPERATION 1 THESIS TITLE i DECLARATION ii DEDICATION iii ACKNOWLEDGEMENT iv ABSTRACT v ABSTRAK vi TABLE OF CONTENTS vii LIST OF TABLES xvi LIST OF FIGURES xviii LIST OF ABBREVIATIONS xxii LIST OF APPENDICES xxv INTRODUCTION 1 1.1 Background of Research 1 1.2 Problem Statement 3 1.3 Research Objectives 4 1.4 Scope of Research 4 1.5 Significance of Study 5 viii 2 LITERATURE REVIEW 6 2.1 ADENOVIRUSES 6 2.1.1 INFECTIBILITY OF ADENOVIRUSES (Ads) 8 2.1.1.1 Adenovirus vector entry uptake into human 8 2.1.1.2 Adenoviral DNA replication: Early and Late transcription 2.1.2 ADENOVIRUS RECEPTORS 10 12 2.1.2.1 COXSACKIE AND ADENOVIRUS RECEPTOR (CAR) 12 2.1.2.1.1 Expression and Distribution 14 2.1.2.1.2 Biology function as adhesion protein 2.1.2.2 INTEGRINS 14 15 2.1.2.3 OTHER RECEPTORS FOR ADENOVIRUS 16 2.2 GENE THERAPY 16 2.3 ADENOVIRUSES AS A GENE THERAPY 19 VECTOR 3 MATERIALS AND METHODS 21 3.1 MATERIALS 21 3.1.1 Chemicals and Reagents 21 3.1.2 Vectors 22 3.1.3 Bacterial Strain 22 3.1.4 Viruses 22 3.1.5 Cell Cultures 23 3.1.6 Antibodies 23 ix 3.3 METHODS 24 3.3.1 GENERAL FLOW METHODOLOGY 24 3.3.2 CONSTRUCTION OF pCAR-DsRed 25 3.3.2.1 Mini Preparation Plasmid DNA Isolation (Mini-Prep Isolation, Qiagen) 25 3.3.2.2 Agarose Gel Electrophoresis (Stellwagen, 1998) 26 3.3.2.3 Amplification of pCAR and pDsRed-Monomer-N1 using Polymerase Chain Reaction (PCR) (Pfx DNA Polymerase) 27 3.3.2.4 PCR Product Purification (GeneJet PCR Purification Kit) 28 3.3.2.5 Restriction Endonucleases and Alkaline Phosphatase Treatment for Vector Plasmid DNA (Thermo Scientific FastDigest® Enzyme) 29 3.3.2.6 DNA Fragments Extraction from Gel (PureLink® Quick Gel Extraction Kit) 30 3.3.2.7 DNA Insert (pCAR) Ligation into Vector plasmid DNA (pDsRed- 31 Monomer-N1) (Thermo Scientific) 3.3.2.8 Preparation of Chemically Competent E. coli DH5α (Chung et al., 1989) 32 3.3.2.9 Transformation of DNA plasmid into competent E. coli DH5α (Chung et al., 1989) 32 x 3.3.2.10 Analysis of Transformants (pCAR-DsRed) by using PCR (2X TopTaq Master Mixture, Qiagen) 33 3.3.2.11 E. coli Storage in Glycerol Stock (Laible, 2011) 34 3.3.3 TRANSFECTION OPTIMISATION OF pCAR-DSRED INTO CHO CELL LINE 34 3.3.3.1 Mammalian Cell Lines Maintenance 34 3.3.3.2 Transfection of Plasmid DNA by using GeneJuice, LipofectamineTM 2000 and Xtreme HP plasmid DNA Transfection Reagent (Novagen, Invitrogen and Roche) 35 3.3.3.3 Selection of Stable Transfected Clone Cells via G418 AntibioticTitration Killing Curve (Ambion Inc.) 36 3.3.4 CAR (CHO-CAR-DSRED) EXPRESSION ANALYSIS 36 PART I CAR mRNA Level Analysis 3.3.4.1 RNA Isolation (GeneJETTM RNA Purification Kit) 36 3.3.4.2 Preparing for cDNA molecules from RNA Isolated (MaximaTM Reverse Transcriptase) 38 3.3.4.3 Quantitative Real-Time PCR (qRT-PCR) Amplification (MaximaTM SYBR Green/Fluorescein qPCR Master Mix (2X)) PART II CAR Protein Level Analysis 39 41 xi 3.3.4.4 Protein Preparation – Cell Lysis by using Radioimmunnoprecipitation Assay (RIPA) Buffer (abcam) 41 3.3.4.5 Sodium Dodecyl Sulfate Polyacrylamide Gel Electrophoresis (SDSPAGE) (Walker, 2009) 41 3.3.4.6 Western Blotting (Mini TransBlot® Bio-Rad) 42 3.3.4.7 Indirect Immunofluorescence Analysis of CAR Expression on the Mammalian Cell Lines (Bacallao et al., 2006) 43 3.3.5 ADENOVIRUS TYPE 5 (Ad5) TECHNIQUES 45 3.3.5.1 High Titer of rAd5 by using Adenovirus Replication Assay (Q-Biogene) 45 3.3.5.2 Purification of Ad5 (Vivapure®AdenoPACKTM 20) 45 3.3.5.3 Viral Particle Titration by using Optical Density (OD) 260 nm Viral Particle per mL (VP/mL) (Maizel et al., 1968) 47 3.3.6 BIOLOGICAL FUNCTION ANALYSIS OF CHO-CAR-DSRED 48 PART I FLUORESCENCE ANALYTICAL METHODS 3.3.6.1. Transfected Cells Analysis by Flow Cytometry (Hunt et al., 2010) 48 xii 3.3.6.2 Virus Infectivity Assays Analysis by Flow Cytometry (Murakami et al., 2010) 49 PART II MICROSCOPIC ANALYSIS 3.3.6.3 Transduction of Ad5EGFP on engineered stable CHO-CARDsRed by using Live-Cell Imaging Microscopic 49 (Murakami et al., 2010) 3.3.6.4 Giemsa Staining (Suchman and Blair, 2007) 4 50 CONSTRUCTION OF COXSACKIE AND ADENOVIRUS RECEPTOR (CAR) TAGGED WITH pDSRED-MONOMER-N1 (pCAR52 DsRed) 4.1 CONSTRUCTION OF pCAR-DSRED 52 4.2 RESULTS AND DISCUSSION 53 4.2.1 Cloning of pCAR into pDsRedMonomer-N1 vector 53 4.2.1.1 Validation and Purification of pCMV-IRES2-CAR-EGFP and pDsRed-Monomer-N1 56 4.2.1.2 PCR amplification of pCAR using recombinant pCMV-IRES2CAR-EGFP DNA as a template 57 4.2.1.3 Restriction Endonucleases (RE) Digestion of Vector (pDsRed-Monomer-N1) 58 4.2.1.4 Analyze Transformants (pCARDsRed) by using PCR Amplification and RE Digestion 60 xiii 4.2.2 Sequencing of pCAR-DsRed plasmid 63 4.2.2.1 Sequencing of pCAR PCR fragments 4.2.2.2 Sequencing of DsRed PCR product 4.3 CONCLUSION 5 63 66 67 ENGINEERED STABLE CELL LINE CONTAINING pCAR-DSRED FOR ADENOVIRUS TYPE 5 INFECTION AND TRANSDUCTION 68 5.1 OPTIMISATION OF TRANSFECTION 68 5.2 RESULTS AND DISCUSSION 70 5.2.1 Optimization of Transfection pDsRedMonomer-N1 plasmid DNA via GeneJuice (Novagen), LipofectamineTM 2000 Transfection Reagent (Invitrogen) and Xtreme HP DNA Transfection Reagent (Roche) 70 5.2.2 Transfection pCAR-DsRed plasmid DNA via GeneJuice (Novagen), LipofectamineTM 2000 Transfection Reagent (Invitrogen) and Xtreme HP DNA Transfection Reagent (Roche) 73 5.2.3 Selection Stable Transfected via G418 Antibiotic 75 5.2.3.1 Titration Killing Curve 75 5.2.3.2 Selection Stable Engineered CHOCAR-DsRed 5.3 CONCLUSION 76 83 xiv 6 CAR EXPRESSION ANALYSIS 84 6.1 DETECTION OF CAR EXPRESSION ON MAMMALIAN CELL LINES 84 6.2 RESULTS AND DISCUSSION 85 6.2.1 Quantitative Analysis of CAR Expression by using Real-Time PCR (qRT-PCR) Amplification 6.2.1.1 Efficiency of 85 ∆∆C T Method 85 6.2.1.2 Quantification of CAR mRNA expression in various cancer cell lines 6.2.2 Western Blotting 6.2.2.1 Protein Level of CAR Expression 88 89 89 6.2.3 Indirect Immunofluorescence via Live Imaging Microscope 6.3 CONCLUSION 7 90 91 SUSCEPTIBILITY OF CHO-CAR-DSRED TOWARDS AD5EGFP TRANSDUCTION AND WT-AD5 INFECTION 92 7.1 INFECTIBILITY OF ADENOVIRUSES 92 7.2 RESULTS AND DISCUSSION 93 7.2.1 Viral Particle (VP) Titration 93 7.2.1.1 Optical Density (OD) 260 nm Viral Particle per mL (VP/mL) of recombinant Ad5 tagged with enhance green fluorescence protein (Ad5EGFP) and wild-type Ad (wt-Ad5) 93 7.2.2 Transduction of Ad5EGFP Assay 95 7.2.2.1 Fluorescence Analytical Analysis by using Flow Cytometry 95 xv 7.2.2.2 Internalisation of Ad5EGFP Observation by using Live-Cell Imaging Microscopic 7.2.3 Infectibility assay with wt-Ad5 7.2.3.1 Giemsa Staining Analysis 99 101 101 7.2.4 Blocking of Ad5EGFP Transduction Assay 103 7.2.4.1 Fluorescence Analysis by using Inverted Fluorescence Microscope 8 REFERENCES 103 7.3 CONCLUSION 106 CONCLUSION AND RECOMMENDATION 107 8.1 CONCLUSION 107 8.2 RECOMMENDATION 108 109 APPENDICES A-E 138 - 148 xvi LIST OF TABLES TABLE NO. TITLE PAGE 2.1 Advantages and disadvantages of non-viral vectors 17 2.2 Advantages and limitations of viral vectors 18 3.1 Specific antibodies used in this study 23 3.2 PCR mixture for RCR reactions 27 3.3 Optimal condition for PCR reactions 27 3.4 The primers used for PCR amplification 28 3.5 Mixture for single restriction enzyme digestion 29 3.6 Mixture for double restriction enzyme digestion 30 3.7 Ligation mixture for pCAR (insert) and pDsRedMonomer-N1 (vector) 31 3.8 PCR reaction mixture of 2X Top Taq Polymerase 33 3.9 The primers used for qRT-PCR amplification 40 3.10 Cycling conditions for two-step qRT-PCR by using SYBR Green/Fluorescein qPCR Master Mix (2X) 3.11 40 Preparation of blank dilutions for Optical Density (OD) 230 nm Viral Particle per mL (VP/mL) 47 xvii 3.12 Preparation of viral dilutions for Optical Density (OD) 230 nm Viral Particle per mL (VP/mL) 3.13 Serial viral dilutions for Optical Density (OD) 230 nm Viral Particle per mL (VP/mL) 7.1 48 Absorbance of the serial dilution of viral particle (VP/mL) of Ad5EGFP 7.2 47 94 Absorbance of the serial dilution of viral particle (VP/mL) of wt-Ad5 94 xviii LIST OF FIGURES FIGURE NO. TITLE PAGE 2.1 Schematic model of an adenoviral particle (adapted from 7 Russell, 2009). 2.2 Binding and internalization of Adenovirus (Adapted from Q- 9 Biogene). 2.3 Schematic Adenoviral infection model (adapted from Greber et al., 1993). 2.4 Early and Late transcription of Adenoviral DNA (Vorburger et al., 2002). 2.5 54 Schematic representation of the construction of pCARDsRed 4.3 19 Diagram illustrates of restriction map and Multiple Cloning Site (MCS) of pDsRed-Monomer-N1 vector (Clontech) 4.2 16 Vectors used in Gene Therapy Clinical Trials (data was provided by the Journal of Medicine) 4.1 13 Adenovirus fiber structure and binding sites (adapted from Zhang and Bergelson, 2005). 2.7 11 Schematic structure of the hCAR protein (adapted from Freimuth et al., 2008). 2.6 10 55 Mini preparation isolation of pCMV-IRES2-CAR-EGFP and pDsRed-Monomer-N1 plasmid DNA 57 xix 4.4 PCR amplification of pCAR using DNA from a recombinant pCMV-IRES2-CAR-EGFP as a template. 4.5 58 Restriction endonuclease digestion of pDsRed-MonomerN1. 4.6 59 Screening of the insert (pCAR) from selective transformant colonies by using PCR amplification. 4.7 61 Restriction endonucleases digestion analysis of a pCARDsRed vector containing pCAR insert. 4.8 63 Alignment of Forward and Reverse sequencing of nucleic acid of the pCAR (pCAR-DsRed) PCR product and human CAR cDNA sequence (accession Y07593). 4.9 65 Alignment of Forward and Reverse sequencing of nucleic acid of the DsRed (pCAR-DsRed) PCR product and synthetic pDsRed cDNA sequence (accession EU827527.1). 5.1 CHO cells transiently transfected with the pDsRedMonomer-N1 plasmid were incubated for 24 hours. 5.2 DNA titration. 69 Cells were analyzed 24 hours post transfection for DsRed expression and cell viability. 5.3 67 71 CHO cells were transfected with selected optimum concentrations of a pCAR-DsRed expression plasmid using GeneJuice, LipofectamineTM 2000 and Xtreme HP transfection reagent respectively. 5.4 74 CHO cells were treated with G418 antibiotic at range of 0.84 - 4.0 mg/mL for 15 days and cells were analyzed for every 3 days selection. 75 xx 5.5 a) FACS analysis of CHO cells (untransfected) as a control. 5.5 b) FACS analysis of CHO-CAR-DsRed cells with selection 1.31 mg/mL G418 antibiotic for 24 days. 5.6 78 79 Transfected CHO-CAR-DsRed cells were selected with 1.31 mg/mL G418 antibiotic for 24 days and reading were taken for every 3 days selection for CAR-DsRed expression. 5.7 Image of CHO-CAR-DsRed cells with selection 1.31 mg/mL G418 antibiotic for 24 days. 6.1 81 82 Standard curve of CAR (TG). Amplification of the standard dilution series of the cDNA target sequence is carried out in separate wells (n=3). 6.2 Standard curve of ß-actin (HKG). 86 Amplification of the standard dilution series of the cDNA target sequence is carried out in separate wells (n=3). 6.3 Comparisons of different amplification efficiencies between CT value of ß-actin (HKG) and CAR (TG). 6.4 86 Detection of mRNA levels of CAR expressions on mammalian cell lines. 6.5 86 88 Protein levels of CAR expressions on various types of cell lines. 89 6.6 Composite images of indirect immunofluorescene. 91 7.1 Fluorescence microscopy of transduction of Ad5EGFP in MDA-MB-231 and CHO cells. 7.2 96 Histograms analysis of Ad5EGFP-mediated transduction in a MDA-MB 231 and CHO cell lines. 97 xxi 7.3 Histograms analysis of Ad5EGFP-mediated transduction in a CHO-CAR-DsRed cell lines. 7.4 The sequential images of live transduction of Ad5EGFP to CHO-CAR-DsRed. 7.5 100 Giemsa staining of wt-Ad5-mediated infection in a HER 911, CHO and CHO-CAR-DsRed cell lines. 7.6 98 102 Transduction of Ad5EGFP at 25 MOI before and after MDA-MB-231 and CHO cells was blocked with anti-CAR 104 polyclonal (H300). 7.7 Transduction of Ad5EGFP at 25 MOI before and after CHOCAR-DsRed cells was blocked with anti-CAR polyclonal (H300). 105 xxii LIST OF ABBREVIATIONS SYMBOLS DESCRIPTION abs absorbances Ad Adenovirus Ads Adenoviruses Ad5 Adenovirus serotype 5 APS Ammonium Persulfate ATCC Animal Tissue Culture Collection BSA Bovine Serum Albumin bp base pair CAR Coxsackie and adenovirus receptor cDNA complementary DNA CHO Chinese Hamster Ovary CO2 Carbon dioxide gas CPE Cytophatic Effect CTX Cortical Thymocyte Xenopus D1 Extracellular Domain 1 D2 Extracellular Domain 2 DNA Deoxyribonucleic acid DsRed Discoscoma Red Fluorescence Protein E. coli Escherichia coli EDTA Ethylene diamine tetraacetate EGFP Enhance green fluorescent protein FBS Fetal Bovine Serum FPs Fluorescence proteins IF Immunofluorescence Ig Immunoglobulin IRES internal ribosome entry site g gram xxiii GFP Green fluorescent protein hAd5 human Adenovirus serotype 5 hCAR human CAR HEK Human embryonic kidney HER Human embryonic retinoblastoma kb kilobase kDa kilo-Dalton L Litre LB Luria Broth M marker µg microgram µL microlitre µm micrometer µM microMolar mA miliAmpere mg miligram mL mililiter MOI Multiplicity of Infection nm nanometer OD optical density P Population PBS Phosphate Buffer Saline PBST Phosphate Buffer Saline with 0.05% Tween 20 PCR Polymerase Chain Reaction pCMV Cephalomycarditis virus plasmid PMSF Phenylmethylsulfonate Q Quadrant qRT-PCR quantitative Real-Time PCR rAd recombinant Adenovirus rAd5 recombinant Adenovirus type 5 RGD Arg-Gly-Asp peptide motif rpm revolution per minute S.O.C Super Optimal broth with Catabolite repression xxiv SYBR Synergy Brands, Inc. (stock symbol) TAE Tris-acetate-EDTA TEMED N,N,N’N’-Tetramethylenediamine UV ultraviolet V voltage WB Western Blot v/v volume by volume ~ approximately o Degree centrigrade % percentage C xxv LIST OF APPENDICES APPENDIX TITLE A Standard Buffers and Solutions B Sequencing of pCAR PCR fragments from recombinant pCAR-DsRed C 143 145 Images of Reduction of Alamar Blue (AB) Solution E 138 Sequencing of pDsRed PCR fragments from recombinant pCAR-DsRed D PAGE 147 Formula Calculation of Percentage of Reduction of Alamar Blue (AB) 148

