VALIDATION OF THE LOW TRANSMITTANCE SCALE
advertisement
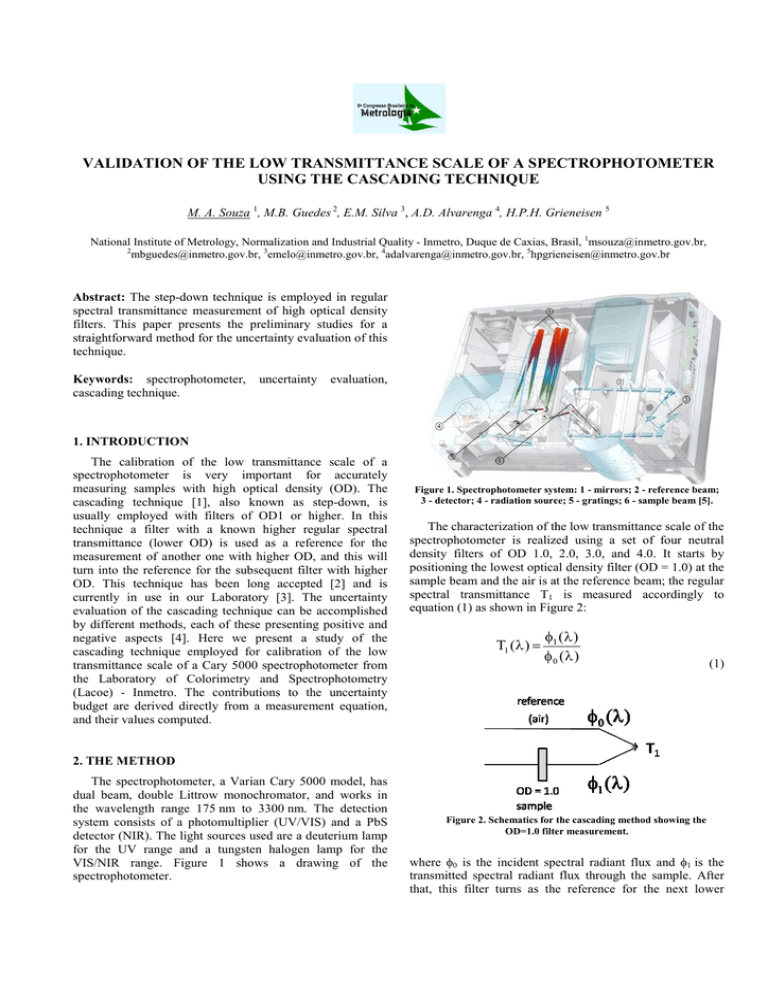
VALIDATION OF THE LOW TRANSMITTANCE SCALE OF A SPECTROPHOTOMETER USING THE CASCADING TECHNIQUE M. A. Souza 1, M.B. Guedes 2, E.M. Silva 3, A.D. Alvarenga 4, H.P.H. Grieneisen 5 National Institute of Metrology, Normalization and Industrial Quality - Inmetro, Duque de Caxias, Brasil, Brasil 1msouza@inmetro.gov.br, 2 mbguedes@inmetro.gov.br, 3emelo@inmetro.gov.br, 4adalvarenga@inmetro.gov.br, 5hpgrieneisen@inmetro.gov.br down technique is employed in regular Abstract: The step-down spectral transmittance measurement of high optical density filters. This paper presents the preliminary studies for a straightforward method for the uncertainty evaluation of this technique. Keywords: spectrophotometer,, cascading technique. uncertainty evaluation, 1. INTRODUCTION The calibration of the low transmittance scale of a spectrophotometer otometer is very important for accurately measuring samples with high optical density (OD). The cascading technique [1], also known as step-down, step is usually employed with filters of OD1 or higher. In this technique a filter with a known higher regular spectral transmittance (lower OD) is used as a reference for the measurement of another one with higher OD, and this will turn into the reference for the subsequent filter with higher OD. This technique has been long accepted [2] and is currently in use in our Laboratory [3]. [ The uncertainty evaluation of the cascading technique can be accomplished accomp by different methods, each of these presenting positive and negative aspects [4]. ]. Here we present a study of the cascading technique employed for calibration of the low transmittance scale of a Cary 5000 00 spectrophotometer from the Laboratory of Colorimetry andd Spectrophotometry (Lacoe) - Inmetro. The contributions to the uncertainty budget are derived directly tly from a measurement equation, equation and their values computed. Figure 1.. Spectrophotometer system: 1 - mirrors; 2 - reference beam; 3 - detector; 4 - radiation source; 5 - gratings; 6 - sample beam [5]. The characterization of the low transmittance scale of the spectrophotometer is realized using a set of four neutral density filters of OD 1.0, 0, 2.0, 2 3.0, and 4.0. It starts by positioning the he lowest optical density filter (OD = 1.0) at the sample beam and the air is at the reference beam; beam the regular spectral transmittance T1 is measured accordingly to equation (1) as shown in Figure 2: 2 T1 (λ ) = φ1 ( λ ) φ 0 (λ ) (1) 2. THE METHOD The spectrophotometer, a Varian Cary 5000 model, has dual beam, double Littrow monochromator, omator, and works in the wavelength range 175 nm to 3300 nm. The detection system consists of a photomultiplier (UV/VIS) and a PbS detector (NIR). The light sources used are a deuterium lamp for the UV range and a tungsten halogen lamp for the VIS/NIR range. Figure 1 shows a drawing of the spectrophotometer. Figure 2. Schematics for the cascading method showing the OD=1.0 .0 filter measurement. where φ0 is the incident spectral radiant flux and φ1 is the transmitted spectral radiant flux through the sample. After that, this filter turns as the reference for the next lower transmittance filter with OD = 2.0, and T21 is then measured as shown in Figure 3. Figure 3. Schematics for the cascading method showing the OD=2.0 .0 filter measurement. The value of the regular spectral transmission of the OD=2.0 filter related to the air, T2, can be obtained from T1 e T21 through the equation (2): T21 (λ) = φ 2 (λ ) T2 (λ) = ⇒ T2 (λ) = T21 (λ ) · T1 (λ ) φ1 (λ ) T1 (λ) OD = n, with n = 1, 2, 3 and 4, using the step-down technique in five wavelengths: 500 nm, 546.1 nm, 590 nm, 635 nm and 750 nm. The spectrophotometer bandwidth was 1.0 nm, scanning with steps of 0.1 0 nm. After repetitions, the standard deviation was calculated using the averaged transmittance values measured for an interval of ± 0.20 nm around the selected wavelength, in order to account for the wavelength expanded uncertainty of the spectrophotometer that is ± 0.13 nm (k = 2.02). Table 2 shows the calculated associated uncertainties. In u(T1) Type A uncertainty was included, included as well as the Type B uncertainty related to the photometric scale of the equipment. uipment. This Type B uncertainty is dependent on the transmittance value and has components that are common to all measured filters,, and have been calculated considering various parameters such as the photometric stability in the short and long-term term (reproducibility), repeatability, heterochromatic scattered light, temperature measurement, meas tracking and resolution. In u(T2), u(T3) and u(T4) only the Type A uncertainties were calculated, as the Type B is already included in u(T1),, accordingly to equation (5). (2) The uncertainty in T2 can be derived from equation (2) using the GUM [6] considering only first order effects: effects 2 ∂T (λ) · u (T1 ) 2 + u (T2 ) 2 = 2 ∂ T ( λ ) 1 546,1 For each increase in OD, there is one more step in the step-down technique ique whereas the last measured filter will reference the next one. Generalizing ng for the measurement of an OD = n, the transmittance is: φ n (λ ) T (λ) = n ⇒ Tn (λ) = Tn ,n −1 (λ) · Tn −1 (λ) φ n −1 (λ) Tn −1 (λ) (4) And the associated uncertainty,, in a first order approximation, is: 2 ∂T (λ ) · u (T1 ) 2 + u (Tn ) 2 = n ∂ T ( λ ) 1 λ (nm) ( ) 500 2 ∂T2 (λ) · u (T21 ) 2 ∂ T ( λ ) 21 (3) Tn ,n −1 (λ) = Table 1. Regular spectral transmittance measured by the step-down step technique technique. 2 ∂Tn (λ ) · u (T21 ) 2 + ∂ T ( λ ) 21 Τ1 Τ2 9.317×10 −02 9.331×10 −02 Τ3 1.095× ×10 −02 1.052× ×10 −02 Τ4 6.903×10 −04 1.35×10−05 7.644×10 −04 1.876×10−05 590 9.401×10−02 1.038× ×10−02 8.602×10−04 2.563×10−05 635 9.496×10−02 1.037× ×10−02 9.766×10−04 3.47×10−05 750 9.788×10−02 1.070× ×10−02 1.330×10−03 6.4×10−05 Table 2. Associated uncertainties. uncertainties λ (nm) ( ) 500 u(T1) 4.3×10 u(T2) −04 5×10 10 −05 u(T3) 4.2×10 u(T4) −06 1.3×10−06 546,1 4.3×10−04 5×10 10−05 4.1×10−06 8.3×10−07 590 4.4×10−04 5×10 10−05 4.7×10−06 9.7×10−07 635 4.4×10−04 5×10 10−05 5.8×10−06 1.0×10−06 750 4.6×10−04 6×10 10−05 1.2×10−05 1.0×10−05 To validate the technique, the data obtained for the filter OD = 4.0 were compared with those from a calibration in CNAM in 2006. There re is a good agreement of the results, shown in Table 3, although our uncertainties, for two points are larger. Table 3. Regular spectral transmittance and uncertainty associated for the filter OD=4.0 measured by the step-down step technique. 2 ∂Tn (λ) · u (Tn ,n −1 ) 2 + ... + ∂ T ( λ ) n , n − 1 λ (nm) (5) 3. RESULTS Table 1 shows the measurement results of spectral regular transmittance related to the air (Tn) for filters of 500 546,1 590 635 750 Lacoe Τ4 1.35×10−05 1.876×10−05 2.563×10−05 3.47×10−05 6.4×10−05 u(T4) 1.3×10 10−06 8.3×10 10−07 9.7×10 10−07 1.0×10 10−06 1.0×10 10−05 Cnam Τ4 2.00×10−05 1.86×10−05 2.570×10−05 3.340×10−05 6.22×10−05 u(T4) 4.4×10−06 2.5×10−06 8.0×10−07 3.0×10−07 4.0×10−06 4. CONCLUSIONS Measurements of regular spectral transmittance were realized for a set of four neutral density filters using the step-down technique. The uncertainty evaluation of the cascading technique can be accomplished by different methods, but the results obtained from the derived of the measurement equation, including type B components as well, are in better agreement with those reported by other NMIs [2]. AKNOWLEDGEMENTS This work was partially supported by fundings of CNPq and FAPERJ under contract numbers 307991/2008-3, E-26/ 110.335/2010 and E-26/ 102.715/2010. REFERENCES [1] K.L. Eckerle, J.J. Hsia, K.D. Mielenz, and V.R. Weidner; “Regular Spectral Transmittance”, NBS Special Publication 250-6, pp 3–33, Gaithersburg, July 1987. [2] G. Obein and J. Bastie, “Report on the CCPR Key Comparison K6 Spectral regular transmittance”, LNE-INM Sept-2008. [3] L.C. Alves, J.F.S. Gomes, J.C.F. Silva, M.B. Guedes, I.B. Couceiro, “Avaliação da Incerteza de Medição de Transmitância Espectral Regular Utilizando a Técnica Step-Down (Cascading)”, Proceedings do Enqualab 2004-Encontro para a Qualidade de Laboratórios, SP, Brasil. [4] Y. Liu and G. Xu, “Practical methods for evaluating wavelengthsetting induced uncertainty in spectral regular transmittance measurement using cascading technique”, Meas. Sci. Technol. 15 (2004) 227–230 [5] UV-VIS-NIR / Varian Cary 4000, 5000, 6000i and Deep UV Spectrophotometers [6] ISO GUM – Guide to the Expression of Uncertainty in Measurement: Terceira Edição Brasileira. RJ, 2003.
