A study on a roughness gauge
advertisement
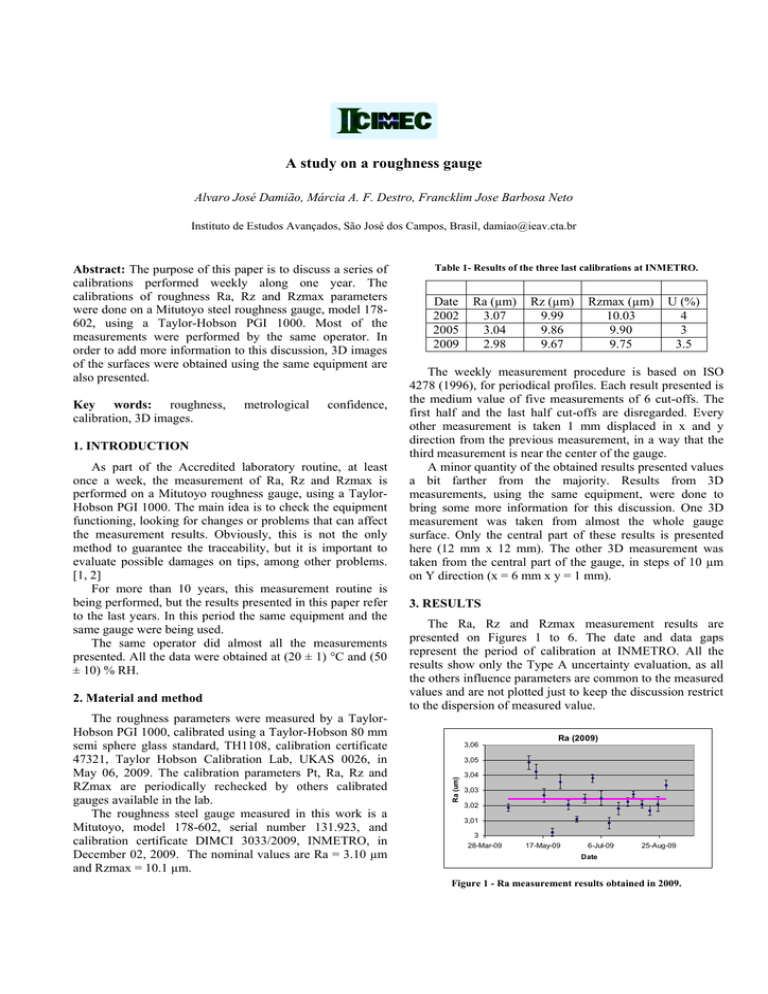
A study on a roughness gauge Alvaro José Damião, Márcia A. F. Destro, Francklim Jose Barbosa Neto Instituto de Estudos Avançados, São José dos Campos, Brasil, damiao@ieav.cta.br Key words: roughness, calibration, 3D images. metrological confidence, 1. INTRODUCTION As part of the Accredited laboratory routine, at least once a week, the measurement of Ra, Rz and Rzmax is performed on a Mitutoyo roughness gauge, using a TaylorHobson PGI 1000. The main idea is to check the equipment functioning, looking for changes or problems that can affect the measurement results. Obviously, this is not the only method to guarantee the traceability, but it is important to evaluate possible damages on tips, among other problems. [1, 2] For more than 10 years, this measurement routine is being performed, but the results presented in this paper refer to the last years. In this period the same equipment and the same gauge were being used. The same operator did almost all the measurements presented. All the data were obtained at (20 ± 1) °C and (50 ± 10) % RH. 2. Material and method The roughness parameters were measured by a TaylorHobson PGI 1000, calibrated using a Taylor-Hobson 80 mm semi sphere glass standard, TH1108, calibration certificate 47321, Taylor Hobson Calibration Lab, UKAS 0026, in May 06, 2009. The calibration parameters Pt, Ra, Rz and RZmax are periodically rechecked by others calibrated gauges available in the lab. The roughness steel gauge measured in this work is a Mitutoyo, model 178-602, serial number 131.923, and calibration certificate DIMCI 3033/2009, INMETRO, in December 02, 2009. The nominal values are Ra = 3.10 µm and Rzmax = 10.1 µm. Table 1- Results of the three last calibrations at INMETRO. Date 2002 2005 2009 Ra (µm) 3.07 3.04 2.98 Rz (µm) 9.99 9.86 9.67 Rzmax (µm) 10.03 9.90 9.75 U (%) 4 3 3.5 The weekly measurement procedure is based on ISO 4278 (1996), for periodical profiles. Each result presented is the medium value of five measurements of 6 cut-offs. The first half and the last half cut-offs are disregarded. Every other measurement is taken 1 mm displaced in x and y direction from the previous measurement, in a way that the third measurement is near the center of the gauge. A minor quantity of the obtained results presented values a bit farther from the majority. Results from 3D measurements, using the same equipment, were done to bring some more information for this discussion. One 3D measurement was taken from almost the whole gauge surface. Only the central part of these results is presented here (12 mm x 12 mm). The other 3D measurement was taken from the central part of the gauge, in steps of 10 µm on Y direction (x = 6 mm x y = 1 mm). 3. RESULTS The Ra, Rz and Rzmax measurement results are presented on Figures 1 to 6. The date and data gaps represent the period of calibration at INMETRO. All the results show only the Type A uncertainty evaluation, as all the others influence parameters are common to the measured values and are not plotted just to keep the discussion restrict to the dispersion of measured value. 3,06 Ra (2009) 3,05 Ra (um) Abstract: The purpose of this paper is to discuss a series of calibrations performed weekly along one year. The calibrations of roughness Ra, Rz and Rzmax parameters were done on a Mitutoyo steel roughness gauge, model 178602, using a Taylor-Hobson PGI 1000. Most of the measurements were performed by the same operator. In order to add more information to this discussion, 3D images of the surfaces were obtained using the same equipment are also presented. 3,04 3,03 3,02 3,01 3 28-Mar-09 17-May-09 6-Jul-09 25-Aug-09 Date Figure 1 - Ra measurement results obtained in 2009. Rz (2009) Rzmax (2010) 9,9 10,1 10,05 Rzmax (um) Rz (um) 9,88 9,86 10 9,95 9,9 9,84 9,85 9,82 7-Apr-09 27-May-09 Date 16-Jul-09 4-Sep-09 Figure 2 - Rz measurement results obtained in 2009 Rzmax (2009) 9,93 9,92 Rzmax (um) 9,91 9,9 9,89 9,88 9,87 26-Jun-09 26-Jul-09 Date 25-Aug-09 24-Sep-09 9,8 13-Mar-10 21-Jun-10 Date 29-Sep-10 Figure 6 - Rzmax measurement results obtained in 2010. The 3D measurements presented interesting results that can contribute to the discussion. The data were obtained using a 100 µm step in Y direction. Two images obtained from the same measurement are presented on Figures 7 and 8. They show the same 3D image viewed from different angles. The image was filtered using ISO 4278 (1996) like in the Ra, Rz and Rzmax results showed previously. The two images are brought to attention in order show that, besides apparently presented as images from different objects, they are not. On Figure 8, a regularly spaced set of curved grooves can be seeing. Nothing unexpected is noticed. Figure 3 - Rzmax measurement results obtained in 2009. 3,05 Ra (2010) 3,04 Ra (um) 3,03 3,02 3,01 3 2,99 13-Mar-10 21-Jun-10 29-Sep-10 Date Figure 7 – 3D image from the roughness gauge. Figure 4 - Ra measurement results obtained in 2010. Rz (2010) 9,87 Rzmax (um) 9,86 9,85 9,84 9,83 9,82 9,81 13-Mar-10 21-Jun-10 29-Sep-10 Date Figure 5 - Rz measurement results obtained in 2010. Figure 8 – Same 3D image of Figure 7, view from other angle. A more detailed 3D result (Figure 8) presents a measurement of the roughness gauge. The data were obtained using a shorter step in Y direction, 10 µm. The area measured was 6mm (X) by 1 mm (Y). Grooves also in Y direction can be noticed, as two patterns were superimposed. 5. CONCLUSION The results of roughness measurements (Ra, Rz and Rzmax) parameters, taken weekly for more than one year, were presented. They were obtained from a Mitutoyo steel roughness gauge, model 178-602, using a Taylor-Hobson PGI 1000. Also 3D images from almost the whole gauge surface showed interesting results. A discussion on the importance of disregarding uncommon results was raised. REFERENCES [1] Goli G., Larricq P., Marchal R., Negri M., J. P. Costes (2001) Surface quality: comparison among visual grading and 3D roughness measuments IWMS 15 Proceedings, pag. 459 – Los Angeles (USA) 30/07 – 01/08 2001. [2] Chin Y. Poon, Bharat Bhushan, Comparison of surface roughness measurements by stylus profiler, AFM and noncontact optical profiler, Wear 190 (1995) 76-88. Figure 9 - The 3D image taken using 10 micrometer Y step. A (un)typical result of one measurement is detailed in Figure 10. It can be noticed that one of the last minima is deeper the others, resulting in a bigger Rzmax value and bigger dispersion. This effect on dispersion appears in some results on Figures 2, 5 and 6. Figure 10 - Detail of on measured track showing a deeper valley. 4. DISCUSSION The results presented show a good reproducibility. But there is a question to be solved: what should be done when a result, like the one presented in Figure 10, shows off during a calibration. It is a result obtained from the surface. Is it a representative result from this surface? This measurement should or not be disregarded? It clearly affects the result and the dispersion. [3] The 3D image on figure 9 shows two (three?) superimposed patterns. The cut-off for this calibration is 0.25 mm, due to a Rsm near 0,1 mm. A minor displacement in Y direction, can take the equipment tip out from a maximum to a minimum, if a “pattern” in Y direction is considered. It will affect directly the result of Ra. It is not uncommon to have this kind o gauge calibrated at an Accredited laboratory. The results in a certificate are part of the traceability chain. To disregard a result or not is an important matter. [3] F. Pavese, On the degree of objectivity of uncertainty evaluation in metrology and testing, Measurement (2009), doi: 10.1016/j.measurement.2009.01.021

