Emerging Markets Multi-Sector Bond Fund Investor: SMSNX SMSNX
advertisement
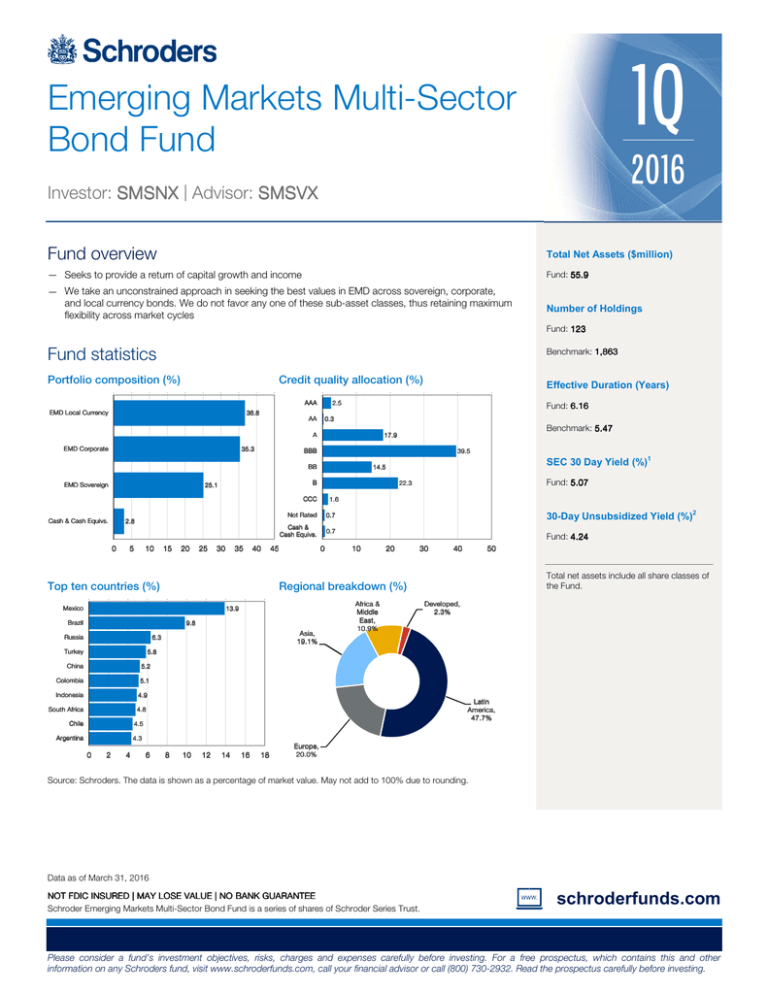
1Q Emerging Markets Multi-Sector Bond Fund 2016 Investor: SMSNX | Advisor: SMSVX Fund overview Total Net Assets ($million) — Seeks to provide a return of capital growth and income Fund: 55.9 — We take an unconstrained approach in seeking the best values in EMD across sovereign, corporate, and local currency bonds. We do not favor any one of these sub-asset classes, thus retaining maximum flexibility across market cycles Number of Holdings Fund: 123 Fund statistics Benchmark: 1,863 Portfolio composition (%) Credit quality allocation (%) AAA EMD Local Currency 36.8 AA Fund: 6.16 0.3 A EMD Corporate 35.3 BBB 39.5 0 1.6 Not Rated 10 15 20 25 30 35 40 Top ten countries (%) 45 13.9 Brazil 9.8 Asia, 19.1% 6.3 Turkey 0.7 0 Fund: 4.24 10 20 30 40 50 Total net assets include all share classes of the Fund. Regional breakdown (%) Mexico Russia 30-Day Unsubsidized Yield (%)2 0.7 Cash & Cash Equivs. 5 Fund: 5.07 22.3 CCC 2.8 SEC 30 Day Yield (%)1 14.5 B 25.1 Cash & Cash Equivs. Benchmark: 5.47 17.9 BB EMD Sovereign Effective Duration (Years) 2.5 Africa & Middle East, 10.9% Developed, 2.3% 5.8 China 5.2 Colombia 5.1 Indonesia 4.9 South Africa 4.8 Chile 4.5 Argentina 4.3 0 2 4 6 Latin America, 47.7% 8 10 12 14 16 18 Europe, 20.0% Source: Schroders. The data is shown as a percentage of market value. May not add to 100% due to rounding. Data as of March 31, 2016 NOT FDIC INSURED | MAY LOSE VALUE | NO BANK GUARANTEE Schroder Emerging Markets Multi-Sector Bond Fund is a series of shares of Schroder Series Trust. schroderfunds.com Please consider a fund’s investment objectives, risks, charges and expenses carefully before investing. For a free prospectus, which contains this and other information on any Schroders fund, visit www.schroderfunds.com, call your financial advisor or call (800) 730-2932. Read the prospectus carefully before investing. Schroder Emerging Markets Multi-Sector Bond Fund Performance* (%) As of March 31, 2016 10 9 8 7 6 5 4 3 2 1 0 Investor Shares Advisor Shares 6.78 6.63 Fees and Expenses (%) as of March 15, 2016 Blended EMD Benchmark Investor Shares Advisor Shares Gross 1.80 2.05 Net 0.90 1.15 6.64 2.54 1.84 1.37 QTD 1.14 1.04 1 Year 0.84 Since Inception Performance shown represents past performance. Past performance is no guarantee of future results and current performance may be higher or lower than the performance shown. Principal value and investment returns will fluctuate so that shares, when redeemed, redeemed, may be worth more or less than their original cost. For the most recent monthmonth-end performance, visit www.schroderfunds.com or call (800) 730730-2932. Performance for periods less than one year is not annualized and performance of periods greater than one year ye ar is annualized. * Please see below for notes accompanying this update. The notes include a description of the index and certain risks associated with investing in the fund. Fund information CUSIP Inception Date Dividend Frequency In order to limit the Fund's expenses, the Fund's adviser has contractually agreed through February 28, 2017 to waive its fees, pay Fund operating expenses, and/or reimburse the Fund to the extent that Total Annual Fund Operating Expenses (other than acquired fund fees and expenses, other indirect acquired fund expenses, interest, taxes, and extraordinary expenses), for the Fund's Investor Shares, exceed 0.90% of Investor Shares' average daily net assets and, for the Fund's Advisor Shares, exceed 1.15% of Advisor Shares' average daily net assets. In addition, the Fund's adviser has contractually agreed through February 28, 2017 to limit the management fees paid by the Fund to 0.65% of the Fund's average daily net assets. The expense limitation and the management fee limitation may only be terminated during their terms by the Board of Trustees. Management team Investor Shares Advisor Shares 80809R808 80809R709 6/25/2013 6/25/2013 Monthly Monthly — Team managed by Jim Barrineau — Over 25 years of experience — The team draws on the expertise of 30+ credit analysts across five continents, with in-market presence in six major emerging countries — In-house economics team Risk: All investments involve risks including the risk of possible loss of principal. The market value of a fund's portfolio may decline as a result of a number of factors, including interest rate risk, credit risk, inflation/deflation risk, mortgage and asset-backed securities risk, US Government securities risk and liquidity risk. Frequent trading of the fund's portfolio may result in relatively high transaction costs and may result in taxable capital gains. Investing overseas involves special risks including among others, risk related to political or economic instability, foreign currency (such as exchange, valuation, and fluctuation) risk, market entry or exit restrictions, illiquidity and taxation. These risks exist to a greater extent in emerging markets than in developed markets. Please see the prospectus for a full description of the risks associated with the Fund. Important Information: Source: Schroders, Barclays Capital. Performance: Total return figures are net of fees and expenses, which includes a .25% distribution fee paid under rule 12b-1 for Advisor Shares only, and reflect reinvestment of all dividends and distributions at net asset value. As described in the prospectus, during certain periods shown, the expenses borne by the Fund were limited by the investment adviser; otherwise total return would have been lower. Index: 1/3 JP Morgan EMBI Global Diversified Index is a uniquely weighted index that tracks total returns for US dollar denominated Brady bonds, Eurobonds, traded loans and local market debt instruments issued by sovereign and quasi-sovereign entities; 1/3 JP Morgan GBI-EM Global Diversified Index is a comprehensive global local emerging markets index that consists of regularly traded, liquid fixedrate domestic currency government bonds; 1/3 JP Morgan CEMBI Broad Diversified tracks total returns of U.S. dollar denominated debt instruments issued by corporate entities in Emerging Markets countries. The CEMBI Broad is the most comprehensive corporate benchmark. Investors may not invest directly in an index. Sector/Securities: Securities holdings, sector breakdowns and credit quality indicate characteristics as of a point in time and may not be representative of the Fund's current or future investments. Portfolio sectors/securities and allocations are subject to change at any time and should not be viewed as a recommendation to buy/sell. Credit/Quality: Schroders receives credit quality ratings on underlying securities of the fund from the three major reporting agencies— S&P, Moody's and Fitch. When calculating the credit quality breakdown, Schroders uses the average rating of the agencies. Securities that are not rated by all three agencies are reflected as such. The ratings exclude cash and cash equivalents. Schroders converts all ratings to the equivalent S&P major rating category for purposes of the category shown. Definitions: 1 SEC 30 day yield reflects the dividends and interest earned during the most recent 30-day period, after the deduction of the Fund’s expenses. 2 30-Day unsubsidized yield does not reflect waivers. Schroder Fund Advisors LLC, Member FINRA, SIPC – 875 Third Avenue, New York, NY 10022-6225 (800) 730-2932 FS-EMMULTISECT
