vii 1 1.1
advertisement

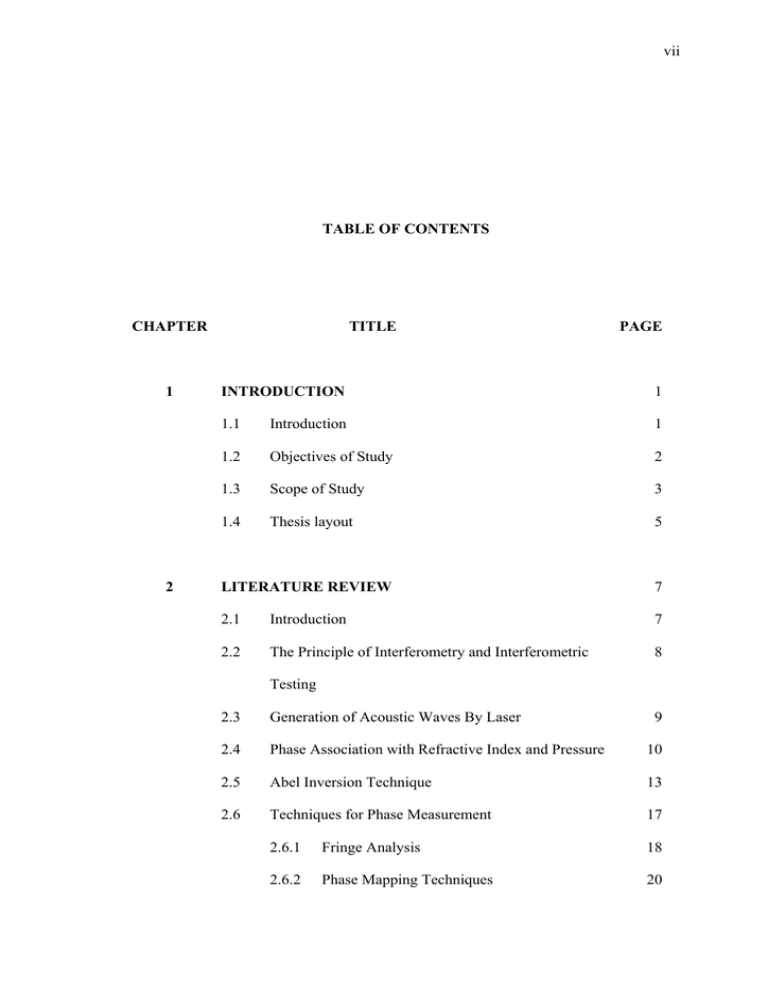
vii TABLE OF CONTENTS CHAPTER 1 2 TITLE PAGE INTRODUCTION 1 1.1 Introduction 1 1.2 Objectives of Study 2 1.3 Scope of Study 3 1.4 Thesis layout 5 LITERATURE REVIEW 7 2.1 Introduction 7 2.2 The Principle of Interferometry and Interferometric 8 Testing 2.3 Generation of Acoustic Waves By Laser 9 2.4 Phase Association with Refractive Index and Pressure 10 2.5 Abel Inversion Technique 13 2.6 Techniques for Phase Measurement 17 2.6.1 Fringe Analysis 18 2.6.2 Phase Mapping Techniques 20 viii 2.6.2.1 Fourier Transform Method 21 2.6.2.2 Carrier Frequency Method 23 2.6.2.3 Phase Shifting Interferometry 24 2.6.2.4 Phase Shifting Algorithms 26 2.6.2.5 Phase Unwrapping 31 2.6.2.6 Error in Phase Unwrapping 34 2.6.2.7 General Error Sources and 36 Measuring Limitations in PSI 3 2.7 Phase Measuring Interferometry versus Fringe Analysis 37 2.8 Simultaneous Phase Measurement Interferometry 38 METHODOLOGY 40 3.1 Introduction 40 3.2 The Laser 42 3.2.1 The Nd:YAG Laser 43 3.2.1.1 44 The Focusing system for Nd:YAG laser 3.2.2 The Nitro-dye Laser 47 3.2.2.1 47 The magnification and the collimation of Dye laser beam 3.3 The Interferometer 49 3.4 Alignment of the Interferometry System 53 3.5 Localization of the Fringes 54 3.6 Magnification and Focusing of the image 55 3.7 Quadrature Imaging 57 ix 3.8 4 5 High-speed Photography System 58 3.8.1 The CCD camera 59 3.8.2 The Frame Grabber 59 3.9 Synchronizing and Triggering 60 3.10 Image Production 64 3.11 Photography Techniques 66 3.12 Phase Retrieval 68 IMAGE PRODUCTION AND IMAGE PROCESSING 71 4.1 Introduction 71 4.2 The Photographic Images 72 4.3 Image Synchronization 76 4.4 Fourier Filtering 77 4.5 The Intensity 80 4.6 The 90° Phase Difference 83 4.7 The Effects of the Number of Fringes and their Shapes 90 4.8 Postprocessing Fringe Patterns 90 4.9 Summary 91 SINGLE-INTERFEROGRAM PHASE 93 INTERFEROMETRY 5.1 Introduction 93 5.2 Fringe Analysis Technique 94 5.3 FFT Phase Mapping Technique 98 5.4 Problems of Single Interferometry Phase Mapping 104 x 5.5 6 Summary SIMULTANEOUS PHASE MEASUREMENT 105 107 INTERFEROMETRY 6.1 Introduction 107 6.2 Simultaneous Phase Measurement Interferometry 108 6.3 Refractive Index, Density and Pressure Profile of 117 Image 6.4 Pressure of Acoustic Waves from Laser Interaction 120 6.5 Image Representation 123 6.6 Comparison with Fringe Analysis 128 6.7 The Advantages of the Simultaneous Phase 130 Measurement 7 6.7.1 Phase Ambiguity Reduction 130 6.7.2 Visual Observation 138 6.7.3 Intensity Independency 138 6.7.4 Fringe Shapes and Sizes 139 6.7.5 User-friendly System 142 6.8 The Disadvantages of the System 142 6.9 Discussion: Error Contributors 143 6.10 Summary 145 CONCLUSION AND RECOMMENDATIONS 147 7.1 147 General Conclusion xi 7.2 Recommendations for Future Work 150 REFERENCES 152 Appendices A-P 160 – 190 xii LIST OF TABLES TABLE NO. Table 4.1 TITLE Some combinations for the 90° phase PAGE 86 difference Table 6.1 Distribution of maximum pressure change 122 xiii LIST OF FIGURES FIGURE NO. 2.1 TITLE Cross section of the spherically symmetrical PAGE 14 refractive index distribution. 2.2 The zone and chordal divisions. 15 2.3 Fringe deviation measurements. 19 3.1 The general layout of the system. 40 3.2 Nd:YAG laser in Gaussian mode and the 45 amplitude distribution in the transverse direction. 3.3 The beam waist w along propagation axis. 45 3.4 Focusing system for Nd:YAG laser. 46 3.5 Magnification of dye laser beam. 48 3.6 The modified Mach Zehnder interferometer with 50 three outputs. 3.7 Fringe Localization. 57 3.8 A U-shaped Aluminium plate as reference frame 58 for the interference pattern. 3.9 Master slave configuration. 60 3.10 Arrangement for controlling the width and delay 62 of the three frame grabbers. 3.11 The optical detector used for laser delay 63 measurement. 3.12 The time chart for image capture 64 3.13 Shadowgraphy arrangement 66 3.14 Schlieren arrangement 67 4.1 The development of acoustic wave propagation 73 using (a) the Schlieren and (b) shadowgraphy techniques xiv 4.2 Stages of development of waves by 74 interferometric method. 4.3 Plot of the radius of wave with time. 75 4.4 Synchronization of center of interaction. 77 4.5 Cut-off frequency in Fourier filtering. 79 4.6 The unfiltered and the filtered intensity signal. 79 4.7 Intensity distributions of the three undisturbed 81 images. 4.8 The filtered intensity of the undisturbed images. 81 4.9 The sequence of the 90°-90° phase difference. 85 4.10 The wrapped phase. 87 4.11 The unwrapped phase wavefronts. 87 4.12 The fluctuation of the 90°-90° phase difference. 88 5.1 (a)The image at 3.6 µs. (b) The corresponding 95 fringe shift. 5.2 Profile of pressure change of the event. 97 5.3 (a)The interferogram at t = 3.6 µs. (b) The phase 100 change profile by FFT method. 5.4 Profile of the corresponding pressure change. 101 5.5 (a) Interferogram at 3.2 µs. (b) The associated 103 phase change exhibiting ambiguity. 5.6 The extra fringe in the interferogram. 104 6.1 The images of laser interaction from the three 110 CCD cameras at 3.6 µs delay. 6.2 Intensity distribution of the three images at y = 15. 111 6.3 The unfiltered an the filtered signals for the three 112 images. 6.4 (a)The wrapped phase spectrum. (b) The 114 unwrapped phase wavefront and its deviation from its reference 6.5 The phase change with the first algorithm 115 6.6 The phase change with the second algorithm 117 6.7 Change in the refractive index due to interaction 118 xv 6.8 Change in density due to laser interaction. 119 6.9 Profile of pressure change of the event. 119 6.10 Distribution of maximum pressure change. 122 6.11 (a)3-D image of phase change with first 125 algorithm. (b) 3-D image of phase change with second algorithm. 6.12 (a) Cross-section of the image. (b) Another view 126 of the cross section. 6.13 A quarter section of the event. 127 6.14 Profile of phase change at different locations 127 across the image. 6.15 Maximum pressure change profiles using the two 128 methods. 6.16 Field of view at three different locations. 130 6.17 Images at t = 3.8 µs. 131 6.18 Phase change profiles individually analyzed. 132 6.19 Phase change profile with simultaneous analysis. 133 6.20 Images at t = 3.4 µs. 133 6.21 Phase change profiles of images when analyzed 134 individually. 6.22 Phase change profile simultaneously analyzed. 135 6.23 Phase change profiles of the three images 137 individually analyzed. 6.24 Phase change profile simultaneously analyzed 138 6.25 Simultaneous phase analysis from high-intensity 140 images 6.26 Phase change from low intensity images 141 xvi LIST OF ABREVIATIONS ξ - spatial frequency coordinate η - high frequency noise 2D, 3D - two and three dimensional α - phase step atm - atmospheric pressure B - Bulk modulus c - Velocity of light CCD - Charge Couple Device CCIR - Comite Consultive International Radio cR - Rayleigh wave velocity ∆F - fringe shift ∆f - fractional fringe shift ∆φ - phase change ∆L - optical path difference ∆n - change in refractive index ∆P - change in pressure ∆ρ - change in density E - electric field amplitude f - frequency xvii FFT - Fast Fourier Transform γ - coherence modulation HD - Horizontal drive synchronization He-Ne - Helium Neon I - intensity ISA - Industry Standard Architecture λ - wavelength LASER - Light Amplification by Stimulated Emission of Radiation MHz - MegaHertz µm - micrometer MOSFET - Metal Oxide Semiconductor Field Effect Transistor µs, ns - microsecond, nanosecond MW - MegaWatt n - refractive index Nd:YAG - Neodymium: Yttrium Aluminium Garnet PAL - Phase Alternation Line PMMA - polymethyl methacrylate PMI - Phase Measurement Interferometry PSI - Phase Shifting Interferometry ρ - density of medium TTL - Transistor Transistor Logic VD - Vertical drive synchronization w - width distribution of laser beam xviii LIST OF APPENDICES APPENDIX TITLE PAGE A Laser Energy Produced At Laser Head. 160 B The Trigger and Synchronize Unit Incorporating the 161 Nd:YAG and Nitro-dye Laser. C Power supply for trigger unit. 164 D Formula Derivation For Simultaneous Phase Measurement. 165 E Acoustic Wave Propagation. 167 F Fringe Analysis. 168 G Simultaneous Phase Measurement. 173 H 3D Representation of the Phase Change 183 I The Cross-section of the Phase Image 187 J Distribution of the Maximum Pressure Change by Fringe 190 Analysis and Simultaneous Method.


