vii TABLE OF CONTENT CHAPTER
advertisement

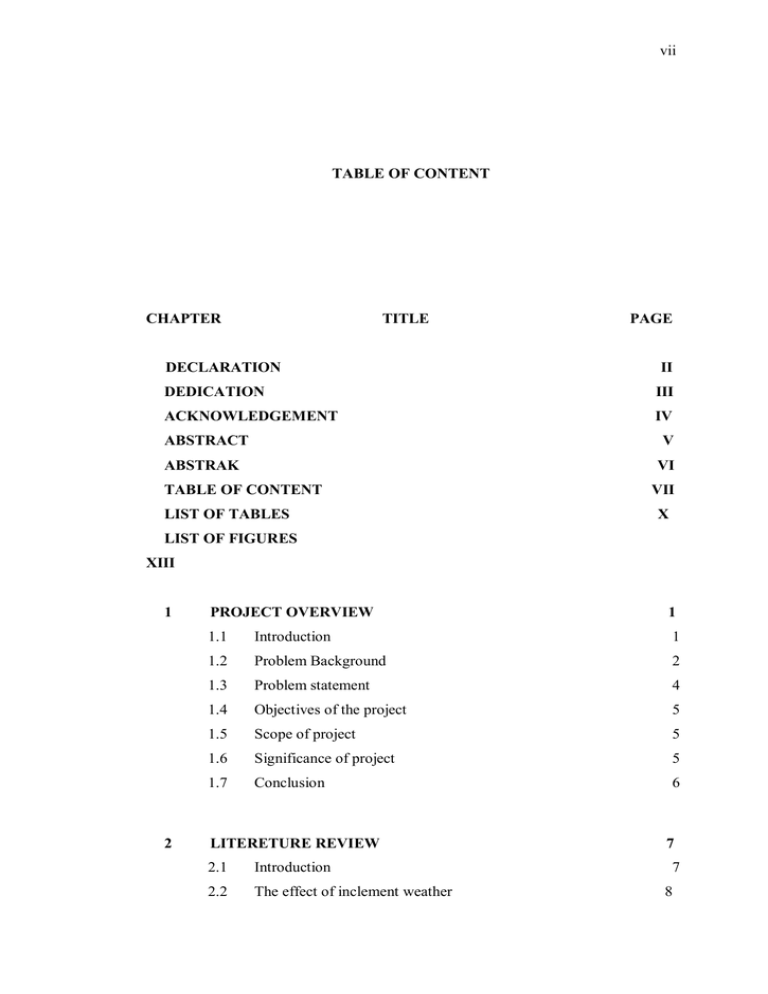
vii TABLE OF CONTENT CHAPTER TITLE DECLARATION PAGE II DEDICATION III ACKNOWLEDGEMENT IV ABSTRACT V ABSTRAK VI TABLE OF CONTENT LIST OF TABLES VII X LIST OF FIGURES XIII 1 2 PROJECT OVERVIEW 1 1.1 Introduction 1 1.2 Problem Background 2 1.3 Problem statement 4 1.4 Objectives of the project 5 1.5 Scope of project 5 1.6 Significance of project 5 1.7 Conclusion 6 LITERETURE REVIEW 2.1 Introduction 2.2 The effect of inclement weather 7 7 8 viii 2.2.1 Hot and Dry conditions 2.2.2 Cold weather 2.3 11 11 2.3.1 Decision support system in construction industry 13 2.3.2 Decision making 15 2.3.3 Analytic hierarchy processes 16 2.3.4 Analytic Network Process 17 2.4 3 Decision support system models 9 Statistics 18 2.4.1 Regression analysis 19 2.4.2 Liner regression analysis 19 2.4.3 Non Liner regression analysis 20 2.4.4 Curve fitting 23 2.4.5 Time series analysis 24 2.4.6 Two general aspect of time series patterns 25 2.5 Statistical decision theory 28 2.6 Principal Component Analysis 28 2.7 Bayesian Probability 31 RESEARCH METHODOLOGY 33 3.1 Introduction 33 3.2 Research procedures 34 3.2.1 Background study 34 3.2.2 Methodology 35 3.2.3 Case study 35 3.2.4 Data Analysis 36 3.2.5 Conclusion and future studies 36 3.3 Proposed model 37 3.4 Identify the variables that affect the building construction 38 3.5 Identify Weight of weather factors 39 3.5.1 Model construction and problem structuring 39 3.5.2 Calculate the priorities and pair wise comparison matrices 40 3.5.3 Selecting the best alternative 42 3.6 Identify the trend of most important weather factor 43 3.6.1 Step1 Recognition of model 43 3.6.2 Step3 recognition of model correction 45 ix 3.7 Non linear regression model 45 3.7.1 Step1: Choose a model 46 3.7.2 Step2: Choose initial values 47 3.7.3 Step3: Transform non linear regression to linear regression 47 3.8 4 DATA ANALYSIS 49 Introduction 49 4.2 Identify the variables 50 4.2.1 Identify weather variables which affect duration 52 4.2.2 Identify the activities which are affected 57 4.2.3 Identify the resource and factors 63 4.3.1 4.4 6 48 4.1 4.3 5 Conclusions Analytical network Structure Framework for Analytical network process Identify the pattern of weather factors 67 68 74 4.4.1 Identify Temperature trend and pattern 75 4.4.2 Identify Humidity trend and pattern 82 4.4.3 Identify Wind trend and pattern 87 4.5 Identify resource pattern and make a non liner model 92 4.6 Test the model with actual Duration 136 4.7 Decision making model 138 4.7.1 Assistant 138 4.7.2 Predictor 138 4.8 Implementation 139 4.9 Conclusion 140 DISCUSSION AND CONCLUSION 141 5.1 Achievement 141 5.2 Obstacle and challenge 142 5.3 Hopes and expectations 143 REFERENCE A-B 145-155 x LIST OF TABLES TABLE NO. TITLE PAGE Table 4.1 Activity list 50 Table 4.2 Weather factors 52 Table 4.3 Correlation Matrix of effect of weather factors on activities 52 Table 4.4 Extract weather factors 53 Table 4.5 Eigenvalues of weather components 54 Table 4.6 Component Matrix of weather factors 56 Table 4.7 Correlation matrix of activities 58 Table 4.8 Extraction Method for activities duration 59 Table 4.9 Extraction method of principal component analysis 60 Table 4.10 Component Matrix for activities 61 Table 4.11 Correlation Matrix of effect of weather factors on activities 63 Table 4.12 Eigenvalues for resources factors 64 Table 4.13 Component Matrix for resources factors 66 Table 4.14 Weather components priority with respect to Human resource 68 Table 4.15 Weather components priority with respect to Material 69 Table 4.16 Weather components priority with respect to Supplier 69 Table 4.17 Activity components priority with respect to Human resource 70 Table 4.18 Activity components priority with respect to Material 70 Table 4.19 Activity components priority with respect to Material 71 Table 4.20 Resource components priority 72 Table 4.21 Resource components priority with respect to Run ceiling 73 Table 4.22 Final Super Matrix for all factors 73 Table 4.23 R square of Linear model 93 xi Table 4.24 25 R square of quadratic model for human resource 93 Table 4.25 R square of Logarithmic model 94 Table 4.26 degree of the temperature vs. human resource productivity 95 Table 4.27 R square of Linear model for Human resource productivity 96 Table 4.28 R square of Quadratic model for Human resource 96 Table 4.29 degree of the Humidity vs. human resource productivity 97 Table 4.30 R square of Linear model for Human resource productivity 98 Table 4.31 R square of Quadratic model for Human resource 99 Table 4.32 degree of the Wind vs. human resource productivity 100 Table 4.33 R square of linear model for material norm 101 Table 4.34 R square of Quadratic model for Material norm 102 Table 4.35 degree of the Wind vs. human resource productivity 103 Table 4.36 R square of linear model for material norm 104 Table 4.37 square of Logarithmic model for material norm 104 Table 4.38 square of Quadratic model for Material norm 105 Table 4.39 degree of the Humidity vs. human resource productivity 106 Table 4.40 R square of linear model for Supplier effectiveness 107 Table 4.41 R square of Logarithmic model Supplier effectiveness 108 Table 4.42 R square of Quadratic model for Supplier effectiveness 108 Table 4.43 degree of the Humidity vs. human resource productivity 109 Table 4.44 R square of linear model for Supplier effectiveness 110 Table 4.45 R square of Logarithmic model Supplier effectiveness 110 Table 4.46 R square of Quadratic model for Supplier effectiveness 111 Table 4.47 degree of the Temperature vs. Supplier efficiency model 112 Table 4.48 R square of multiple model 113 Table 4.49 Analysis of variance of the model human resource 114 Table 4.50 Coefficients of variables in the human resource 115 Table 4.51 The excluded variable details of human resource 115 Table 4.52 R square of multiple model for material norm estimation 117 Table 4.53 Analysis of variance of the Material norm model 117 Table 4.54 Coefficients of variables in the material norm model 118 Table 4.55 R square of multiple model 119 Table 4.56 Analysis of variance of the Supplier efficiency model 120 Table 4.57 Coefficients of variables in the supplier efficiency model 121 xii Table 4.58 R square of Linear model for 122 Table 4.59 R square of Logarithmic model for Construction 123 Table 4.60 R square of Quadratic model for Construction 123 Table 4.61 degree of the Material norm Vs w6 125 Table 4.62 R square of Linear model for w6 125 Table 4.63 R square of Logarithmic model 126 Table 4.64 R square of Quadratic model for Construction 126 Table 4.65 degree of the Supplier efficiency 128 Table 4.66 R square of Linear Human resource productivity 129 Table 4.67 68 R square of Linear model for Construction 129 Table 4.68 R square of Linear model for Construction and installation 129 Table 4.69 degree of the human resource Productivity Vs Construc 131 Table 4.70 R square of multiple model for estimating Construction 132 Table 4.71 Analysis of variance of W6 133 Table 4.72 Coefficients of variables in the w6 133 Table 4 73 Duration of Construction and installation steel structure 136 Table 4 74 Sign test for Actual data and estimated 137 Table4 75 p value of sign test 137 xiii LIST OF FIGURES FIGURE NO. TITLE PAGE 2.1 Productivity trends[2] 14 2.2 Site data[2] 14 2.3 Forecasting and managerial decision making[17] 16 2.4 Linear regression model diagram [26] 20 2.5 Nonlinear regression model diagram[29] 22 2.6 Algorithm of linear regression model[30] 23 2.7 Time series diagram [33] 25 2.8 time series analysis[37] 26 2.9 principal components Analysis 30 3.1 Methodology Diagram 37 3.2 Network structure 40 3.3 Pairwiase comparison of Scale for ANP 41 3.4 Super Matrix 42 4.1 Scree plot weather factors 55 4.2 Component plot of weather factors 57 4.3 Scree plot of activity factors 62 4.4 Scree plot of resources 65 4.5 Analytical Network process Structure 67 4.6 Trend of Temperature over time 75 4.7 Trend analysis of temperature 76 4.8 Auto correlation function for temperature 77 4.9 ACF OF temperature after difference method 77 4.10 Partial auto correlation function for difference 1 78 xiv 4.11 run test for normality of residual 79 4.12 Parameter estimation 80 4.13 Value of forecast in next 10 periods 81 4.14 Trend of Humidity over time 82 4.15 ACF of Humidity over time 83 4.16 PACF OF Humidity 83 4.17 Residual analysis of humidity factor 84 4.18 Run Test for residual 85 4.19 model of AR (1) 86 4.20 ACF of WIND force for first difference method 87 4.21 ACF OF Wind force after second differences 88 4.22 PACF OF Wind force after second differences 89 4.23 Residual plots of Wind after second difference method 90 4.24 Run test for normality 90 4.25 Forecast value of wind for 9 next month 91 4.26 Curve fitting for Temperature VS Human resource Productivity 94 4.27 Curve fitting for Humidity VS Human resource Productivity 97 4.28 Curve fitting for Humidity VS Human resource Productivity 99 4.29 Curve fitting for Wind VS Material norm 102 4.30 Curve fitting for Humidity VS Material norm 106 4.31 Curve fitting for Humidity vs Supplier efficiency 109 4.32 Curve fitting for Temperature vs Supplier efficiency 111 4.33 Curve fitting for Duration of Construction and installation steel structure activity VS material norm 4.34 Curve fitting for Duration of Construction and installation steel structure activity VS supplier efficiency 4.35 4.37 127 Curve fitting for Duration of Construction and installation steel structure activity VS supplier efficiency 4.36 124 130 the procedure of computing duration of the activity on conditioned with resources and weather factors 135 Demos of DSS for Construction company in KISH 139


