Understanding Genetics: Human Traits
advertisement

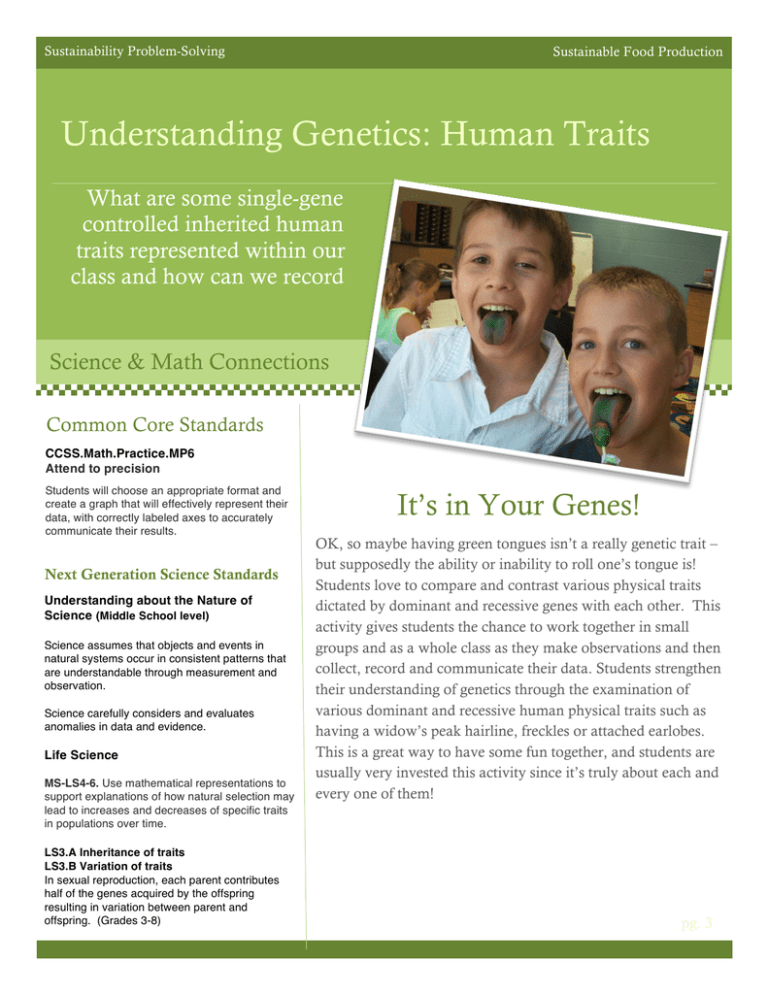
Sustainability Problem-Solving Sustainable Food Production Understanding Genetics: Human Traits What are some single-gene controlled inherited human traits represented within our class and how can we record Science & Math Connections Common Core Standards CCSS.Math.Practice.MP6 Attend to precision Students will choose an appropriate format and create a graph that will effectively represent their data, with correctly labeled axes to accurately communicate their results. Next Generation Science Standards Understanding about the Nature of Science (Middle School level) Science assumes that objects and events in natural systems occur in consistent patterns that are understandable through measurement and observation. Science carefully considers and evaluates anomalies in data and evidence. Life Science MS-LS4-6. Use mathematical representations to support explanations of how natural selection may lead to increases and decreases of specific traits in populations over time. LS3.A Inheritance of traits LS3.B Variation of traits In sexual reproduction, each parent contributes half of the genes acquired by the offspring resulting in variation between parent and offspring. (Grades 3-8) It’s in Your Genes! OK, so maybe having green tongues isn’t a really genetic trait – but supposedly the ability or inability to roll one’s tongue is! Students love to compare and contrast various physical traits dictated by dominant and recessive genes with each other. This activity gives students the chance to work together in small groups and as a whole class as they make observations and then collect, record and communicate their data. Students strengthen their understanding of genetics through the examination of various dominant and recessive human physical traits such as having a widow’s peak hairline, freckles or attached earlobes. This is a great way to have some fun together, and students are usually very invested this activity since it’s truly about each and every one of them! pg. 3 Sustainability Problem -Solving How Sustainable Food Production It’s All About Me! OK, It’s About You, Too. Have your class observe and survey the frequency of different genetic traits with the population of the classroom. Take the raw data and have students create appropriate graphics to communicate and share the results. Explain to students that the class will be exploring the frequency of dominant and recessive traits within their population. Have students work in small groups of 6-8 students to begin. Give each group a “Human Traits Group Survey” and have them record their findings. Once each group is finished with their surveys, reconvene as a whole class to share out their data. Did anyone have any difficulty determining certain phenotypes, such as attached or detached earlobes? Work out any issues as a class until all data sets are complete. Record the class data so everyone can see it. Encourage students to record the data in their notebooks as well. Ask the students to brainstorm ways to communicate the class data graphically, besides in a table or tallied list. Students can use technology or generate their graphics by hand. • Can students create graphics that are correct and to scale? • Did they include the necessary labels and measurements so another person could clearly understand their information? • Is their work done neatly and with care? • Did any students come up with particularly original or unique ways to communiate the information? What analysis and connections do the students have about the results? Are there any differences in frequencies of phenotypes in males or females? Were there more recessive or dominant traits evident? Do they think there is a correlation between a trait being dominant and more people having that phenotype? If not, what factors might be some contributing factors within the class population? Discuss with students that some inherited traits are carried on more than one set of genes, such as eye color, but are also considered dominant and recessive traits. See if they can determine which eye color(s) are which. (Hint: Brown is dominant.) Remind students that there are no inherited traits that are “weird” or inferior – just normal differences between 2 Sustainability Problem -Solving Sustainable Food Production Human Traits Group Survey Number of people in survey group: ____________ (Make sure your survey results for each category add up to the total number of people in your survey group to maintain accuracy of your data set.) Trait Dominant Recessive Freckles Freckles: No Freckles: Hairline shape Widow’s Peak: Straight: Chin feature Cleft: Not Cleft: Earlobes Detached: Attached: Tongue Rolling Can Roll Tongue: Can’t Roll Tongue: Colorblindness Colorblind: Not Colorblind: 3


