What is being Done????????? Conservation Programs (PARAGRAPH WRITTEN TO DESCRIBE WHAT IS BEING
advertisement
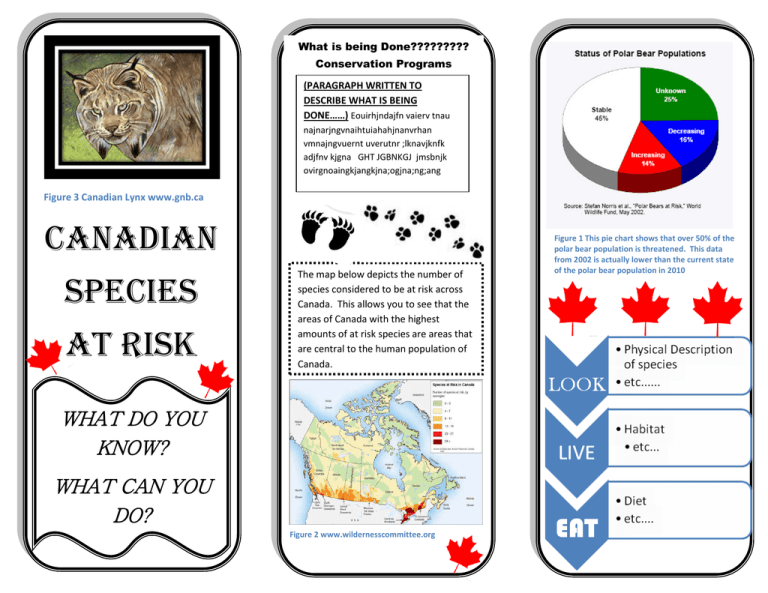
What is being Done????????? Conservation Programs (PARAGRAPH WRITTEN TO DESCRIBE WHAT IS BEING DONE……) Eouirhjndajfn vaierv tnau najnarjngvnaihtuiahahjnanvrhan vmnajngvuernt uverutnr ;lknavjknfk adjfnv kjgna GHT JGBNKGJ jmsbnjk ovirgnoaingkjangkjna;ogjna;ng;ang Figure 3 Canadian Lynx www.gnb.ca CANADIAN SPECIES AT RISK The map below depicts the number of species considered to be at risk across Canada. This allows you to see that the areas of Canada with the highest amounts of at risk species are areas that are central to the human population of Canada. WHAT DO YOU KNOW? WHAT CAN YOU DO? Figure 2 www.wildernesscommittee.org Figure 1 This pie chart shows that over 50% of the polar bear population is threatened. This data from 2002 is actually lower than the current state of the polar bear population in 2010
