AnS 440 Using Spreadsheet Techniques
advertisement

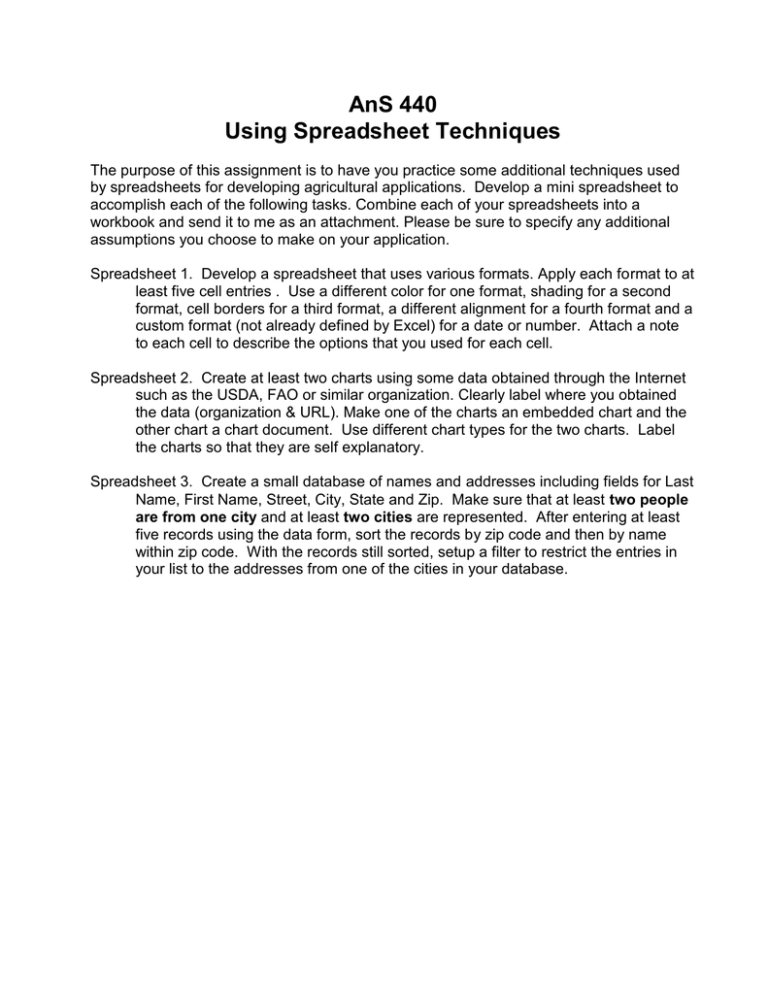
AnS 440 Using Spreadsheet Techniques The purpose of this assignment is to have you practice some additional techniques used by spreadsheets for developing agricultural applications. Develop a mini spreadsheet to accomplish each of the following tasks. Combine each of your spreadsheets into a workbook and send it to me as an attachment. Please be sure to specify any additional assumptions you choose to make on your application. Spreadsheet 1. Develop a spreadsheet that uses various formats. Apply each format to at least five cell entries . Use a different color for one format, shading for a second format, cell borders for a third format, a different alignment for a fourth format and a custom format (not already defined by Excel) for a date or number. Attach a note to each cell to describe the options that you used for each cell. Spreadsheet 2. Create at least two charts using some data obtained through the Internet such as the USDA, FAO or similar organization. Clearly label where you obtained the data (organization & URL). Make one of the charts an embedded chart and the other chart a chart document. Use different chart types for the two charts. Label the charts so that they are self explanatory. Spreadsheet 3. Create a small database of names and addresses including fields for Last Name, First Name, Street, City, State and Zip. Make sure that at least two people are from one city and at least two cities are represented. After entering at least five records using the data form, sort the records by zip code and then by name within zip code. With the records still sorted, setup a filter to restrict the entries in your list to the addresses from one of the cities in your database. Spreadsheet 4. Demonstrate the use of a Pivot Table to summarize the following data. TRT parity 1 2 1 2 1 2 1 2 1 2 1 2 1 2 1 2 1 2 1 2 1 2 1 2 2 2 2 2 4 4 4 4 6 6 6 6 1 1 1 1 5 5 3 3 3 3 5 5 #Born Alive 9 13 12 6 15 11 14 11 13 11 8 8 7 10 9 8 13 8 10 11 9 8 12 7 #Born Dead 0 1 2 0 1 2 2 3 1 0 0 7 0 1 0 1 0 1 1 0 0 1 0 0 Spreadsheet 5. Define a problem or use one of the MCS programs and then use the solver feature of Excel to optimize a solution to the problem. Be sure to explain what you have optimized.


