Precalculus Midterm Exam Review Problems - Chapter 1
advertisement
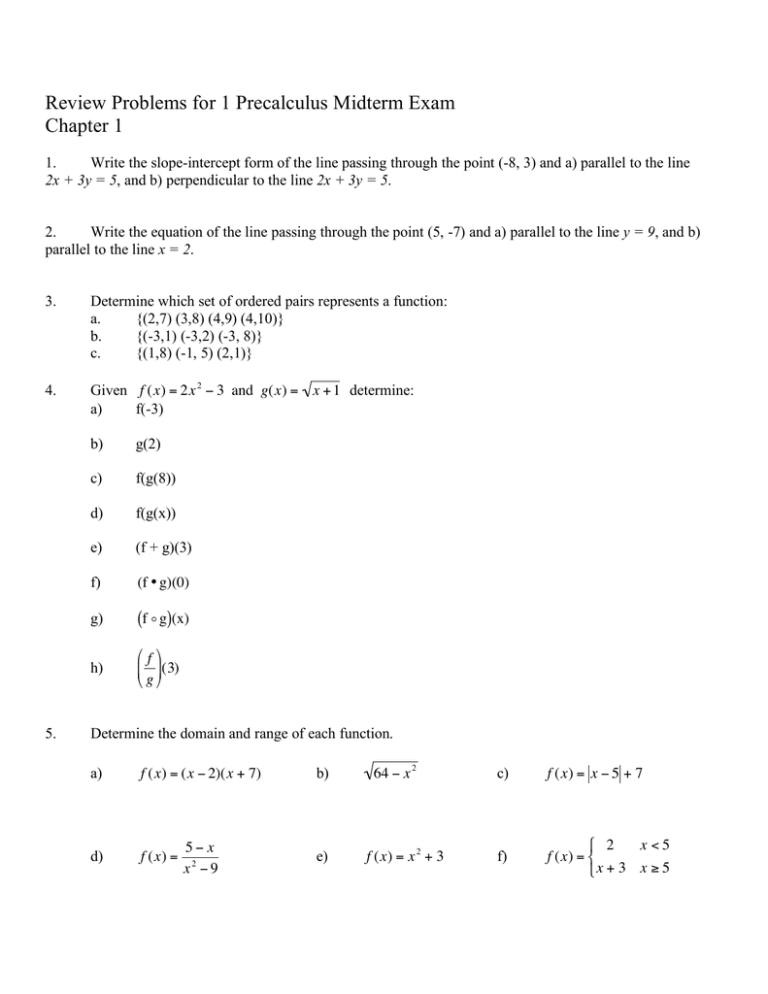
Review Problems for 1 Precalculus Midterm Exam
Chapter 1
1.
Write the slope-intercept form of the line passing through the point (-8, 3) and a) parallel to the line
2x + 3y = 5, and b) perpendicular to the line 2x + 3y = 5.
2.
Write the equation of the line passing through the point (5, -7) and a) parallel to the line y = 9, and b)
parallel to the line x = 2.
3.
Determine which set of ordered pairs represents a function:
a.
{(2,7) (3,8) (4,9) (4,10)}
b.
{(-3,1) (-3,2) (-3, 8)}
c.
{(1,8) (-1, 5) (2,1)}
4.
Given f (x) = 2x 2 " 3 and g(x) = x + 1 determine:
a)
f(-3)
!
b)
g(2)
c)
f(g(8))
d)
f(g(x))
e)
(f + g)(3)
f)
(f • g)(0)
g)
(f o g)(x)
h)
"f%
$ '(3)
# g&
!
!
5.
!
Determine the domain and range of each function.
a)
f (x) = (x " 2)(x + 7)
d)
5" x
f (x) = 2
x "9
!
!
b)
64 " x 2
!
e)
!
f (x) = x 2 + 3
!
!
c)
f (x) = x " 5 + 7
f)
# 2
x <5
f (x) = $
%x + 3 x " 5
6.
Use your graphing calculator to graph the equation and use the vertical line test to determine if the
equation represents a function.
a)
b)
y = x 2 " 2x + 5
c)
y =± x+3
y = 3x + 7
7.
Use your graphing calculator to graph the equation and determine the open intervals on which the
!
!
!
function is increasing, decreasing, or constant.
a)
8.
b)
y = x 2 + 2x + 1
y = x "2 +5
c)
y = (x "1)(x + 2)(x + 1)
c)
y = x2 " 3
Sketch the graph of the piecewise-defined function by hand.
!
! 9.
$ x2 + 7
f (x) = % 2
& x " 5x + 6
x <1
x #1
!
!
Determine if the function is even, odd, or neither.
a)
b)
y = x3
y = (x " 3) 2
10.
Identify the common function f (i.e. parent function) and describe the sequence of transformations from
!
!
!
f(x) to h(x).
y = (x + 2) 2 + 7
b)
y ="x+3
c)
y=
d)
y = x +1 " 7
e)
y = 4x2 " 7
f)
y =5+ 3 x +5
c)
3
!
11.
Determine the inverse of f(x).
!
12.
1
x+2
2
a)
a)
y=
!
!
7
x "1
!
b)
!
y = x2 " 7
x+7
The table shows the sales S (in millions
! from 1995 to 2002.
! of dollars) for Timberland
! a) Use your graphing calculator to find a linear regression model.
b) Graph the equation in your calculator. Interpret the slope of the model in the context of the problem.
c) Use the model to find the year in which sales will exceed $1300 million.
Year
Sales, S
1995
655.1
1996
690.0
1997
796.5
1998
862.2
1999
917.2
2000
1091.5
2001
1183.6
2002
1190.9
