The case for small caps in a
advertisement

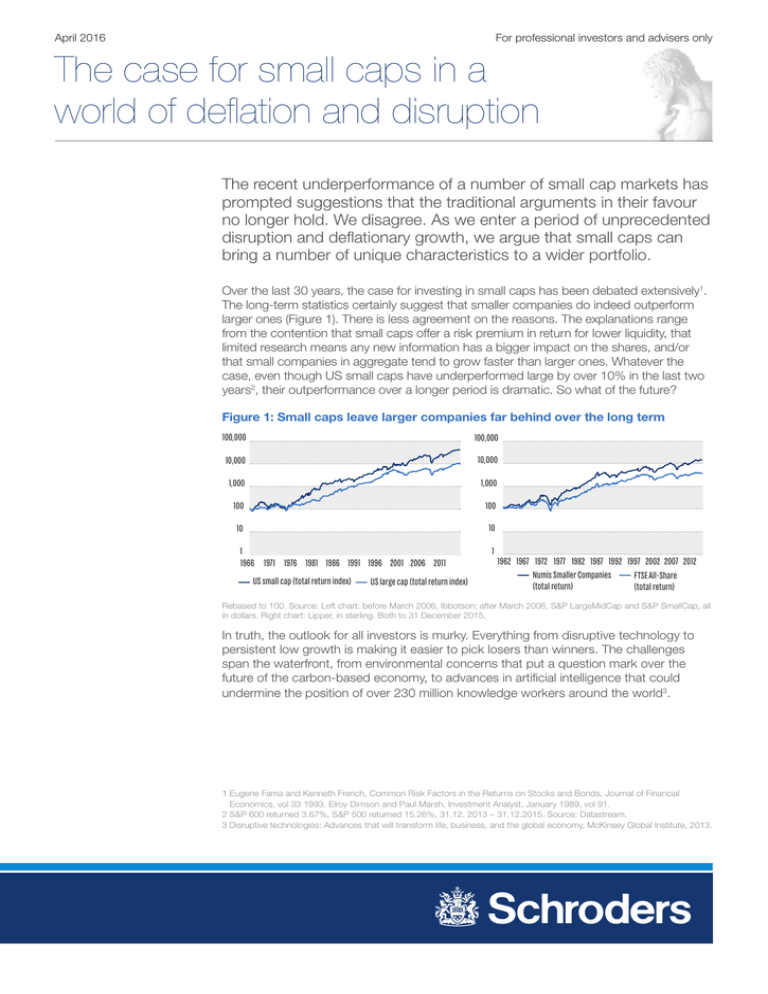
April 2016 For professional investors and advisers only The case for small caps in a world of deflation and disruption The recent underperformance of a number of small cap markets has prompted suggestions that the traditional arguments in their favour no longer hold. We disagree. As we enter a period of unprecedented disruption and deflationary growth, we argue that small caps can bring a number of unique characteristics to a wider portfolio. Over the last 30 years, the case for investing in small caps has been debated extensively1. The long-term statistics certainly suggest that smaller companies do indeed outperform larger ones (Figure 1). There is less agreement on the reasons. The explanations range from the contention that small caps offer a risk premium in return for lower liquidity, that limited research means any new information has a bigger impact on the shares, and/or that small companies in aggregate tend to grow faster than larger ones. Whatever the case, even though US small caps have underperformed large by over 10% in the last two years2, their outperformance over a longer period is dramatic. So what of the future? Figure 1: Small caps leave larger companies far behind over the long term 100,000 100,000 10,000 10,000 1,000 1,000 100 100 10 10 1 1966 1971 1976 1981 1986 1991 1996 2001 2006 2011 US small cap (total return index) US large cap (total return index) 1 1962 1967 1972 1977 1982 1987 1992 1997 2002 2007 2012 Numis Smaller Companies FTSE All-Share (total return) (total return) Rebased to 100. Source: Left chart: before March 2006, Ibbotson; after March 2006, S&P LargeMidCap and S&P SmallCap, all in dollars. Right chart: Lipper, in sterling. Both to 31 December 2015. In truth, the outlook for all investors is murky. Everything from disruptive technology to persistent low growth is making it easier to pick losers than winners. The challenges span the waterfront, from environmental concerns that put a question mark over the future of the carbon-based economy, to advances in artificial intelligence that could undermine the position of over 230 million knowledge workers around the world3. 1 Eugene Fama and Kenneth French, Common Risk Factors in the Returns on Stocks and Bonds, Journal of Financial Economics, vol 33 1993. Elroy Dimson and Paul Marsh, Investment Analyst, January 1989, vol 91. 2 S&P 600 returned 3.67%, S&P 500 returned 15.26%, 31.12. 2013 – 31.12.2015. Source: Datastream. 3 Disruptive technologies: Advances that will transform life, business, and the global economy, McKinsey Global Institute, 2013. 2 Schroders The case for small caps in a world of deflation and disruption In these circumstances, and contrary to received wisdom, we think more winners may be found amongst the mass of lesser-known and under-researched smaller companies than amongst their larger brethren. With innovation and technological advances moving at an unprecedented pace, companies that are nimble and less burdened by layers of management may be better equipped to keep up with these changes. In this environment, having a strong brand, a large installed base and a wide distribution network are not necessarily assets anymore. Instead we are seeing a new generation of winners that are “capital light” and have a strong online presence. As industries evolve in this direction, barriers to entry are reduced and innovations progress faster, creating increasing opportunities for small companies. However, periods of disruptive innovation inevitably create losers as well as winners. One classic period was the dot com bubble. During most of this time, the US small cap index underperformed the large cap index (Figure 2, left). However, a very different story emerges when the small cap universe is broken down into sectors. Smaller pharmaceutical, biotechnology and software companies outperformed the US S&P 500 Index of larger companies, whereas traditional industries, such as banking and retailing, lagged behind (Figure 2, right). This shows how vital it is to be able to actively pick winners when disruption occurs. Figure 2: Dissecting the dot com bubble 160 150 140 130 120 110 100 90 80 70 60 500 400 300 200 100 0 1998 1999 S&P SmallCap 600 Index 2000 2001 S&P 500 large cap index 1998 S&P 500 Small banks 1999 2000 Small Biotechnology Small Pharmaceuticals 2001 Small Retailing Small Software Rebased to 100. Source: Datastream, January 1998 – December 2001. What often handicaps traditional companies when it comes to developing or adopting a disruptive innovation is the fear of cannibalising their existing revenues. In contrast, smaller and newer companies not tied to an established product have more incentive to direct resources to the next disruptive innovation. Medical technology is a good example of this. Historically, incumbent providers of medical equipment, such as video scopes for internal examinations, focused on reusable technology that is high margin, but also expensive. Clearly, these incumbents had little incentive to produce a lowercost alternative as such a course would have eaten into demand for their existing products. This allowed Ambu, a small cap technology company with fewer existing sales to defend, to launch a single-use alternative which was both cheaper and came with a lower risk of infection. Not surprisingly, this has allowed Ambu to disrupt the existing market and gain market share. There are, of course, a number of examples of large technology suppliers operating in markets where the “winner takes all”. Here the so-called FANG companies with dominant technology (Facebook, Amazon, Netflix and Google) often use their substantial cash reserves to buy up smaller competitors. For investors in the shares of these publicly-traded small companies, this is clearly good news, even if it may limit their opportunities for making even larger gains. 3 Schroders The case for small caps in a world of deflation and disruption Of course, not all small technology companies are publicly quoted. With return prospects low, venture capital financing is popular and often more readily available than other sources of finance (Figure 3). In this environment, innovative companies may remain private long after the development stage, denying investors the chance to piggy-back on rapid growth. For example, the electric car manufacturer Tesla floated when it was valued at over $2 billion, while the app-based taxi group Uber remains private and is already worth over $50 billion. However, we would argue that the publicly listed universe of companies still provides ample opportunity to find disrupters. For example, at the end of February, the technology sector accounted for 3.8% of the FTSE SmallCap Index, more than twice the figure for either the FTSE All-Share or the FTSE 100 indices. In the tech-heavy NASDAQ index in the US, about 65% of the constituents by number are valued at $500 million or less4. Figure 3: Venture capital is increasingly popular amongst smaller companies $ millions 2011 20,000 2012 2013 2014 2015 15,000 10,000 5,000 912 1,102 1,023 1,012 904 1,008 985 Q1 Q2 Q3 Q4 Q1 Q2 Q3 1,094 954 1,051 1,106 1,182 1,038 1,195 1,079 1,129 1,063 1,206 1,149 962 Q4 Q1 Q2 Q3 Q4 Q1 Q2 Q3 Q4 Q1 Q2 Q3 Q4 0 Amount Invested Number of deals Source: MoneyTree Report from National Venture Capital Association and PricewaterhouseCoopers, plus Thomson Reuters, 31 December 2015. Beyond these general characteristics, we would identify a number of specific areas where smaller companies enjoy advantages not necessarily shared by their larger rivals: Unfilled niches: Success can come by moving into a gap in the market that others may be too large to occupy profitably. Xing, a German-based professional network platform provider, is an example. It has grown by running a career-based network exclusively for German speakers, an area that may have been of less interest to larger players. Similarly, specialist Japanese restaurant booking system Kakaku.com now dominates the market in Japan, while competitors such as OpenTable have aimed for the global market. The rapidly growing market for safety products is another niche that offers fertile ground for smaller companies. For instance, the industrial protective clothing market is expected to grow at 11.5% per year until 20225, boosting protective clothing suppliers such as Ansell. This is an example of a smaller company that has been around for a while, yet remains well placed to capitalise on changes in the market around it. Ansell shows that companies don’t need to be constantly innovating in order to grow. Smaller companies may already be in a niche which undergoes a step change in demand due to external factors, essentially being in the right place at the right time. Pricing power: Smaller companies’ ability to focus on a niche market should be particularly important now, when deflation is a threat. At such times, the ability to set and maintain prices becomes increasingly important. Normally, larger, more dominant companies have much greater pricing power than smaller companies. However, even smaller producers may be able to dominate a niche, command a high degree of pricing power and thereby provide some protection against deflation. 4 Source: FTSE Group and NASDAQ. 5 Grand View Research (2015) Industrial Protective Clothing Market Analysis. Schroders The case for small caps in a world of deflation and disruption 4 YOOX Group is one example of a company which dominates a niche. YOOX offers online fashion retailers such as Net-a-Porter greater global reach and local expertise, with its unrivalled network of logistics and digital centres around the world. YOOX is likely to have greater pricing power as luxury retailers who want to distribute globally will be significantly disadvantaged if they use a less comprehensive distributor, even if they are cheaper. On the other hand, large distributors like Amazon, with less focus on luxury brands, may be unattractive to these kinds of retailers. Better balance sheets: Surprisingly, quoted small caps may also boast sounder finances than large listed stocks. Certainly, they are less likely to undertake share buybacks, which tend to increase financial gearing. Some $58 billion of debt raised in the second quarter of 2015 was spent on buybacks or dividends6, at the time the highest figure on record. Much of this seems to have been expended by larger companies, which are much more likely to have buyback schemes than mid and small caps (Figure 4). For companies with a large market share, this is likely to be one of the few ways they can boost growth in the current low-growth economic climate. Figure 4: The biggest companies buy back the most shares % 90 80 70 60 50 40 30 20 1991 1993 1995 1997 1999 S&P 500 2001 2003 S&P MidCap 400 2005 2007 S&P SmallCap 600 2009 2011 2013 Source: S&P Dow Jones and Compustat. Data from 1991 to 2013. Investment impact: Smaller companies may offer investors a better way to tap into changing consumer trends. Thus, a number of well-established small caps are thriving on the back of the growth in specialist nutrition. Smaller companies that were traditionally producers of commodities, such as palm oil producer AAK or natural extracts company Naturex, are seeing increasing demand as society becomes more health conscious. Similarly, trends for larger companies to cut costs can be a big boost for smaller, niche providers. One such is RIB Software, whose products help to increase efficiency in the use of resources in construction projects. While these changes may benefit large companies as well, they are likely to have a greater impact on the earnings of smaller companies which may specialise in producing only one or two products. Lower profile: The good name of a well-known company is easily tarnished by bad publicity, as Google, Starbucks and Volkswagen can testify from recent events. By contrast, smaller companies often operate under less media and market scrutiny than their larger rivals. Indeed, they may benefit from larger companies’ efforts to avoid adverse headlines. For example, supply chains are now consolidating around reliable and reputable suppliers as larger companies seek to mitigate the risk of possible scandal. An example of this is the high-quality textile manufacturer ECLAT, which has benefited from shifting its business towards ethical, high-quality fabric production, at the expense of larger scale manufacturers which have traditionally focused more on quantity than on quality. 6 Bloomberg and Sundial Capital Research. Schroders The case for small caps in a world of deflation and disruption 5 Conclusions Given the outlook for low economic growth and increasing technological disruption, we believe investors should pay particular attention to small caps. This environment will make life hard for large companies, whereas smaller companies have the opportunity to gain market share and grow faster than the market. At a time of unprecedented technological, social and regulatory change, small companies may be able to operate “below the radar” and dominate niches which are likely to grow in light of these changes. For investors, each investment will need to be evaluated on a company by company basis. They should not rely on the assumption that the small cap premium will operate universally. Being able to sort the wheat from the chaff will be vital to the success of a small cap portfolio. Katie Green, Official Institutions, and Matthew Dobbs, Head of Global Small Cap Important information: The views and opinions contained herein are those of Katie Green, Official Institutions, and Matthew Dobbs, Head of Global Small Cap, both at Schroders, and may not necessarily represent views expressed or reflected in other Schroders communications, strategies or funds. This document is intended to be for information purposes only and it is not intended as promotional material in any respect. The material is not intended as an offer or solicitation for the purchase or sale of any financial instrument. The material is not intended to provide, and should not be relied on for, accounting, legal or tax advice, or investment recommendations. Information herein is believed to be reliable but Schroder Investment Management Ltd (Schroders) does not warrant its completeness or accuracy. The data has been sourced by Schroders and should be independently verified before further publication or use. No responsibility can be accepted for error of fact or opinion. This does not exclude or restrict any duty or liability that Schroders has to its customers under the Financial Services and Markets Act 2000 (as amended from time to time) or any other regulatory system. Reliance should not be placed on the views and information in the document when taking individual investment and/or strategic decisions. Past performance is not a guide to future performance and may not be repeated. The value of investments and the income from them may go down as well as up and investors may not get back the amounts originally invested. Exchange rate changes may cause the value of any overseas investments to rise or fall. Investments in smaller companies can be less liquid than investments in larger companies and price swings may therefore be greater than in larger company funds. Investments that focus on specific sectors can carry more risk than investment spread over a number of different industry sectors. The forecasts included in this document should not be relied upon, are not guaranteed and are provided only as at the date of issue. Our forecasts are based on our own assumptions which may change. We accept no responsibility for any errors of fact or opinion and assume no obligation to provide you with any changes to our assumptions or forecasts. Forecasts and assumptions may be affected by external economic or other factors. Company names are mentioned for illustrative purposes only and should not be viewed as a recommendation to buy or sell securities issued by those companies. FTSE International Limited (“FTSE”) © FTSE. “FTSE®” is a trade mark of London Stock Exchange Plc and The Financial Times Limited and is used by FTSE International Limited under licence. All rights in the FTSE indices and / or FTSE ratings vest in FTSE and/or its licensors. Neither FTSE nor its licensors accept any liability for any errors or omissions in the FTSE indices and / or FTSE ratings or underlying data. No further distribution of FTSE Data is permitted without FTSE’s express written consent. Issued in April 2016 by Schroder Investment Management Limited, 31 Gresham Street, London EC2V 7QA. Registration No. 1893220 England. Authorised and regulated by the Financial Conduct Authority. w48690


