Land i Kansas. A F V
advertisement

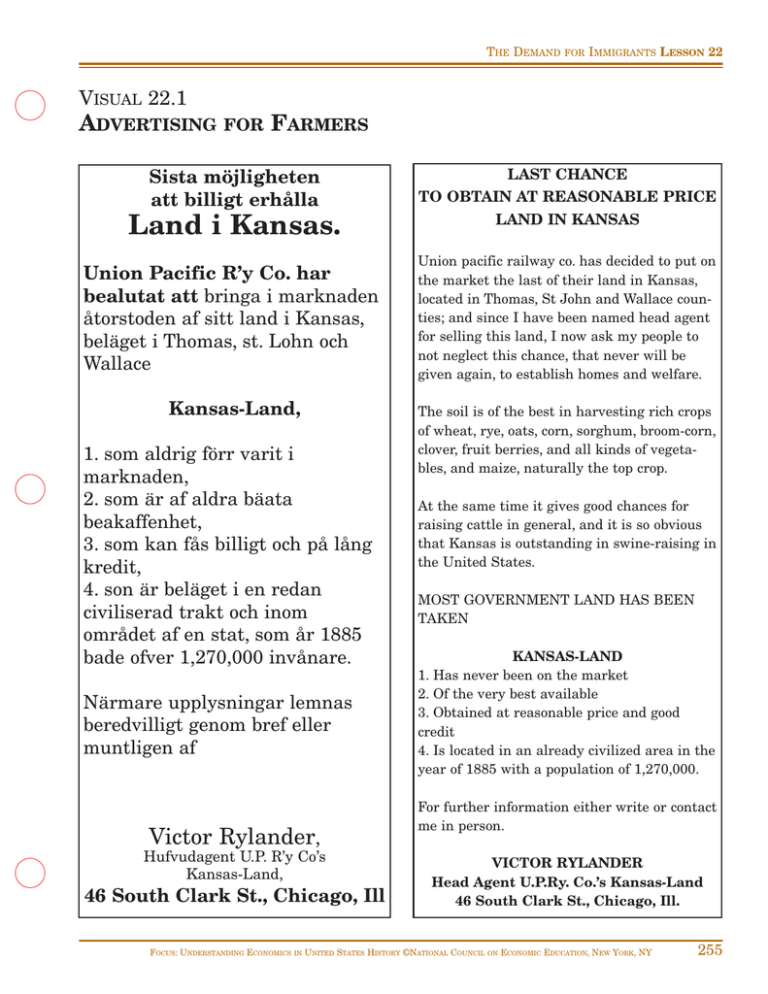
THE DEMAND FOR IMMIGRANTS LESSON 22 VISUAL 22.1 ADVERTISING FOR FARMERS Sista möjligheten att billigt erhålla Land i Kansas. Union Pacific R’y Co. har bealutat att bringa i marknaden åtorstoden af sitt land i Kansas, beläget i Thomas, st. Lohn och Wallace Kansas-Land, 1. som aldrig förr varit i marknaden, 2. som är af aldra bäata beakaffenhet, 3. som kan fås billigt och på lång kredit, 4. son är beläget i en redan civiliserad trakt och inom området af en stat, som år 1885 bade ofver 1,270,000 invånare. Närmare upplysningar lemnas beredvilligt genom bref eller muntligen af Victor Rylander, Hufvudagent U.P. R’y Co’s Kansas-Land, 46 South Clark St., Chicago, Ill FOCUS: UNDERSTANDING ECONOMICS IN LAST CHANCE TO OBTAIN AT REASONABLE PRICE LAND IN KANSAS Union pacific railway co. has decided to put on the market the last of their land in Kansas, located in Thomas, St John and Wallace counties; and since I have been named head agent for selling this land, I now ask my people to not neglect this chance, that never will be given again, to establish homes and welfare. The soil is of the best in harvesting rich crops of wheat, rye, oats, corn, sorghum, broom-corn, clover, fruit berries, and all kinds of vegetables, and maize, naturally the top crop. At the same time it gives good chances for raising cattle in general, and it is so obvious that Kansas is outstanding in swine-raising in the United States. MOST GOVERNMENT LAND HAS BEEN TAKEN KANSAS-LAND 1. Has never been on the market 2. Of the very best available 3. Obtained at reasonable price and good credit 4. Is located in an already civilized area in the year of 1885 with a population of 1,270,000. For further information either write or contact me in person. VICTOR RYLANDER Head Agent U.P.Ry. Co.’s Kansas-Land 46 South Clark St., Chicago, Ill. UNITED STATES HISTORY ©NATIONAL COUNCIL ON ECONOMIC EDUCATION, NEW YORK, NY 255 LESSON 22 THE DEMAND FOR IMMIGRANTS VISUAL 22.2 IMMIGRATION TO THE Number of people migrating from all countries Year 256 UNITED STATES, 1871 – 1920 1871-1875 1,726,796 1876-1880 1,085,395 1881-1885 2,975,683 1886-1890 2,270,930 1891-1895 2,123,879 1896-1900 1,563,685 1901-1905 3,833,076 1906-1910 4,962,310 1911-1915 4,459,831 1916-1920 1,275,890 FOCUS: UNDERSTANDING ECONOMICS IN UNITED STATES HISTORY ©NATIONAL COUNCIL ON ECONOMIC EDUCATION, NEW YORK, NY THE DEMAND FOR IMMIGRANTS LESSON 22 VISUAL 22.3 PRODUCTIVE RESOURCES • Natural Resources • Labor Resources • Capital Resources • Entrepreneurial Resources FOCUS: UNDERSTANDING ECONOMICS IN UNITED STATES HISTORY ©NATIONAL COUNCIL ON ECONOMIC EDUCATION, NEW YORK, NY 257 LESSON 22 THE DEMAND FOR IMMIGRANTS VISUAL 22.4 DEMAND FOR LABOR BY AMERICAN BUSINESS FIRMS S1 WAGE OF WORKERS W1 D1 Q1 QUANTITY 258 FOCUS: UNDERSTANDING ECONOMICS IN OF WORKERS UNITED STATES HISTORY ©NATIONAL COUNCIL ON ECONOMIC EDUCATION, NEW YORK, NY


