Optimization of Functional MRI Techniques for Tumor and Normal Tissue Response to RT
advertisement
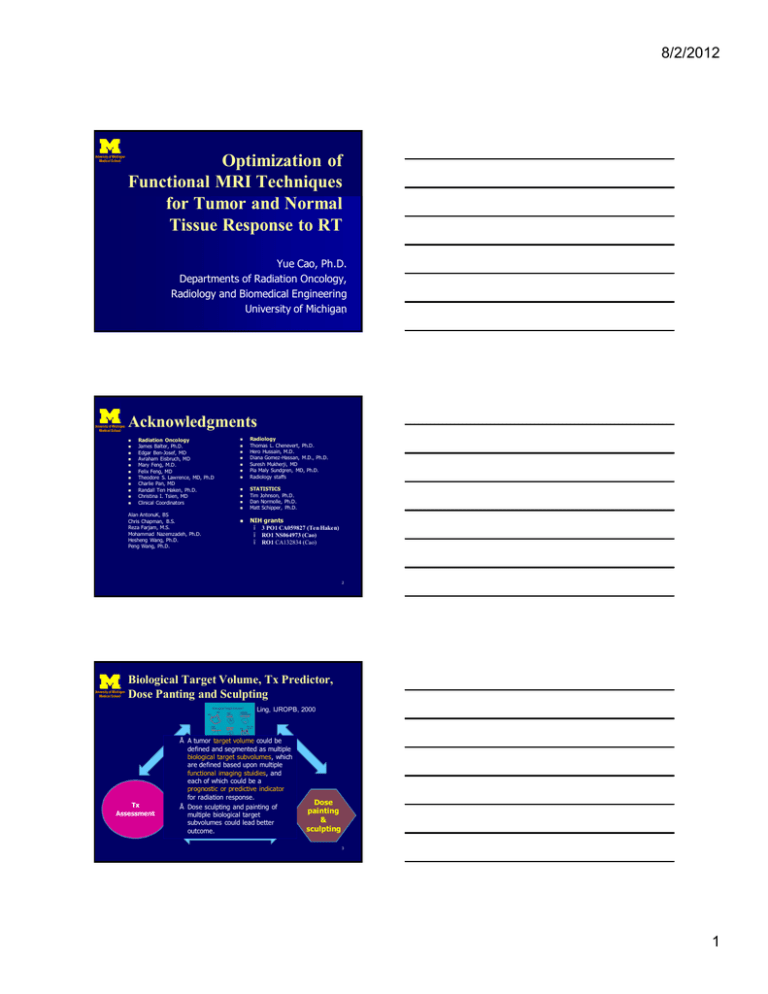
8/2/2012 Optimization of Functional MRI Techniques for Tumor and Normal Tissue Response to RT Yue Cao, Ph.D. Departments of Radiation Oncology, Radiology and Biomedical Engineering University of Michigan 1 Acknowledgments n n n n n n n n n n n Radiation Oncology James Balter, Ph.D. Edgar Ben-Josef, MD Avraham Eisbruch, MD Mary Feng, M.D. Felix Feng, MD Theodore S. Lawrence, MD, Ph.D Charlie Pan, MD Randall Ten Haken, Ph.D. Christina I. Tsien, MD Clinical Coordinators n n n n n n n n n n n Alan AntonuK, BS Chris Chapman, B.S. Reza Farjam, M.S. Mohammad Nazemzadeh, Ph.D. Hesheng Wang, Ph.D. Peng Wang, Ph.D. n Radiology Thomas L. Chenevert, Ph.D. Hero Hussain, M.D. Diana Gomez-Hassan, M.D., Ph.D. Suresh Mukherji, MD Pia Maly Sundgren, MD, Ph.D. Radiology staffs STATISTICS Tim Johnson, Ph.D. Dan Normolle, Ph.D. Matt Schipper, Ph.D. NIH grants – 3 PO1 CA059827 (Ten Haken) – RO1 NS064973 (Cao) – RO1 CA132834 (Cao) 2 Biological Target Volume, Tx Predictor, Dose Panting and Sculpting Ling, IJROPB, 2000 Tx Assessment • A tumor target volume could be defined and segmented as multiple biological target subvolumes, which are defined based upon multiple functional imaging stuidies, and each of which could be a prognostic or predictive indicator for radiation response. • Dose sculpting and painting of multiple biological target subvolumes could lead better outcome. Dose painting & sculpting 3 1 8/2/2012 Imaging Biomarker for Therapy Assessment Ø Longitudinal study • Repeated measures • Reliability, reproducibility, robustness Ø Sensitive indicator (biomarker) Ø Prognostic or Predictive biomarker • Sensitive to therapy-induced changes • predict Tx response and outcome • surrogate endpoint 4 Physiological MRI Ktrans DCE Diffusion Hepatic Perfusion CBV DTI 5 How to Establish a Imaging Biomarker for Therapy Assessment Ø Reproducibility Ø Sensitivity and specificity Ø Utility • Separation of a true change from variation • end points, problem-specific • therapy selection • adaptive therapy for intensification or toxicity reduction 6 2 8/2/2012 Reproducibility Ø NCI RIDER project • • Ø A set of articles describe importance, procedures and statistical analysis for test and re-test (Translational Oncology, 2, 2009) Test and retest data (NBIA database) What level of change in parameter should be observed to be confident that there has been a true change in the parameter in an individual patient? 7 How to determine repeatability from Test and Retest Data Ø Ø Within-subject SDw of a parameter Repeatability Coefficient of a parameter • RC=2.77SDw RC defines 95% confidence interval Ø A true change from a subject has to be Ø • |upost-upre| >RC Barnharts et al, Translational Oncology, 2, 2009 8 Repeatability of Segmenting Cinglum Fiber Track Ø Ø Develop a method for segmenting cinglum, a fiber track connecting to hippocampus, for assessment of radiation-induced cognitive dysfunction Evaluate reproducibility of segmented volumes and DTI indices Nazemzadeh, et a WED-G-217A-4 AAPM 2012 dice coefficient: overlapped volumes RC: uncertainty of parameters 9 3 8/2/2012 Fractional Anisotropy Changes in Patients Received WBRT (W2-pre RT) Posterior cinglum RC uncertainty -RC 95%CI Ture change -RC Nazemzadeh, et al AAPM 2012 10 How to determine reproducibility of an image parameter 18% 1. 22% 2. 21% 3. 21% 4. 19% 5. Use correlation coefficient Use pair t test Use repeatability coefficient Use visual inspection Ask a radiolgist 11 Sensitivity and Specificity Ø Endpoints Prognostic or Predictive indicator for tumor response to therapy Clinical outcomes, local control, survival, PFS… Radiographic response Pathophysiology For normal tissue radiation toxicity Clinical outcome (symptom) Radiation dose Independently established measure 12 4 8/2/2012 Imaging-driven ResponseInduced Subvolume of a Tumor ØHypothesis • • Heterogeneous therapy response of a tumor could be primarily due to biological heterogeneity in the tumor The most aggressive or resistant sub-volume in a tumor could predominantly determine therapy response or outcome of a tumor ØAim • Develop a methodology to delineate physiological imaging–driven subvolume of a tumor • Predictive for treatment response • Highly reproducible • Potential candidate to be a boost target 13 How to identify sub-volumes Ø Ø Ø Generate a feature space of tumors defined by a joint histogram of physiological imaging parameters from “training” tumors Joint histogram (feature space) Classify the distribution of tumor features (joint histogram) using fuzzy c-means to determine globally-defined probability membership functions of the classes Create the subvolumes (metric and map) of each individual tumor using the probability membership functions and physiological images of the tumor Clustering analysis to determine PMF of classes Subvolumes of each tumor (metric and map) Test for Tx response 14 Brain metastases Pre-RT T1 rCBV 0.15 Ktrans 0.15 Responsive Stable probability membership function Create a single metric, a subvolume of a tumor with high CBV, Ktrans, or both, for assessment of response 0 Phigh(rCBV) Phigh(K trans) 0 Phigh,high(rCBV,K trans) Farjam, et al AAMP 2012 WE-C-BRA-5 Week 2 Pre-RT 1 0 15 5 8/2/2012 Does the tumor subvolume with high CBV predict response? Ø End point – Post-RT radiographic response • DGTVpost=GTV1mpost – GTVpreRT • Non-responsive: DGTVpost decreases <25 % Ø Early prediction for non-responsive tumors • A change in the subvolume with high CBV, high Ktrans, or both at the end of WBRT • Receiver operating characteristics (ROC) 16 Sensitivity and Specificity Prediction for non-responsive tumors AUC 0.86 + . 0.80+ . 0.70+ . 0.66+ . 0.61+ . Farjam, et al AAMP 2012 WE-C-BRA-5 17 Poorly Perfused Sub-Volumes in Advanced HN Cancers Local Failure BV Local Control Poorly perfused Subvolume The large sub-volumes of the tumors with low BV (blue color) pre-Tx and during the early course of CRT (2 weeks) are significantly associated with18LF. Wang, et al Med Phys 2012 6 8/2/2012 Prediction of Local Failure 19 Wang, et al Med Phys 2012 Association with Pattern Failure Poorly-perfused Subvolume pre RT FDG 3 mon post RT 20 Subvolumes of a Tumor Ø Ø Ø Ø A physiological imaging defined response-induced subvolume of a tumor could be a candidate for intensified therapy target Our approach can be applied to other physiological/metabolic imaging parameters Our method does not depend upon the voxel level accuracy of registration of a pair of images acquired over a period of therapy Our method produces the metrics robust to image noise and other random factors 21 7 8/2/2012 How to determine sensitivity and specificity of a parameter 21% 2. Use a clinical end point & ROC analysis Recruit 500 patients 21% 3. Repeat the same study 21% 4. Ask a radiation oncologist 5. Increase signal-to noise ratio of the image 18% 20% 1. 22 Normal Tissue Function Ø Radiation-induced tissue toxicity is a complex, dynamic and progressive process Ø Individual sensitivity to radiation limits the utility of dose-based NTCP models Ø Determination of specific risks versus benefits of treatment should be an integral part of clinical decision making for each patient 23 How to assess normal tissue/organ function Ø Assess normal tissue/organ function • Dynamic changes in organ function from pre to during and to post RT • Spatially resolved volumetric distribution of function • Individual sensitivity to dose and pre-RT dysfunction Ø Early measures predict organ functional risks of radiation Ø Re-optimization of individual patients’ treatment plans and early intervention for tissue/organ protection 24 8 8/2/2012 MRI Perfusion Imaging to Assess Liver Function Ø Patients with high risks or poor liver function • HCC with or without cirrhosis • Large tumor • Previous treatments, TACE, surgery, RT, RFA Ø General paradigm • DCE MRI scans: pre, during (~50%), 1 month after RT 25 Individual Perfusion Response Spatial perfusion changes are related to regional doses Cao, et al. IJROBP, in press 26 Pre RT 1 mon Post RT Evaluation of Perfusion with Overall Liver Function Indocyanine green: Independent measure of overall liver function r = 0.7 p <0.001 27 9 8/2/2012 Dose-Dependent Spatial Perfusion Changes * 28 Early Prediction of Post-RT Perfusion Change Ø Linear mixed effects model to account for individual random effects log( Fidj ) = a + ai + g 0 Fitj + b d j+bi d j + eij Post-RT Perfusion for Subject i in region j received dose d Pre- or during-RT Dose in region j Perfusion for Subject i in region j Model 1: independent variable: pre-RT perfusion, total dose, predictor: total dose (p<.0007) Model 2: independent variable: pre-RT perfusion, during-RT perfusion, total dose predictor: pre-RT perfusion (p<.03), 29 during RT perfusion (p<0.0001) Liver Perfusion Imaging Ø Ø Ø Evaluation of hepatic perfusion imaging using an independent liver function measure Perfusion imaging could be used to select “expendable” segments or regions to direct high doses Individual patients who show high risk for injury during RT could be selected for lower doses to prevent from liver injury 30 10 8/2/2012 Localization and Detection of Prostate Cancer Using MRI Ø Ø Ø Ø DCE, DW, T2W and MRS DCE MRI is superior to diffusion, T2W, and MRS. Combining DCE, diffusion, T2W or MRS seem to result in marginal improvement A lower rate of localization of cancer is in transition zone than in peripheral zone. 31 T2W MRI kep Ktrans Localization of Prostate Cancer Using DCE MRI Ø Overall, sensitivity:74-93%, specificity: 79-96% • Visual inspection and scored by radiologists • Depend upon the experience of reading radiologists, imaging acquisition protocol, and the derived parameters from DCE MRI as well as image processing approaches • Tell nothing about the impacts of tumor size and tumor density 32 Pathological Validation for Prostate Cancer Delineation Ø Compare DCE MRI and MRS with histological specimens (Schmuecking et al, 2009) • DCE MRI parameters are not able to detect the lesions with a size less than 3 mm and/or containing less than 30% of tumor cells • MRS is failed to detect the lesion with a size less than 8 mm and/or containing 50% of cancer cells. • DCE MRI defined volumes underestimates the histological volumes, especially in cases with a diffuse tumor growth with low cancer cell density • DCE MRI for localization of prostate cancer is equally good as Cho PET/CT 33 11 8/2/2012 Cancer Detection by DCE MRI Missed lesion: size < 3 mm and containing < 30% of cancer cells (Schmuecking 2009) 34 Cancer Detection by DCE MRI Prostate cancer with a lesion size of 9x3.7 mm and a cancer cell density of >30% was detected by DCE-MRI (orange lesion); but MRS shows a normal spectrum with a low choline peak (Schmuecking 2009) 35 Summary Ø Reproducibility Ø Sensitivity and specificity • Uncertainty of the methods as a whole • A parameter for a problem of interest Ø Ø Ø Automated algorithms for supporting decision making standardizations • imaging protocols, pharmacokinetic models, quantitative metrics for a particular problem QC/QA of imaging acquisition and parameter extraction 36 12 8/2/2012 Pathological Validation for prostate GTV definition Ø Prostate GTV delineated by combination of diffusion and DCE MRI by a radiation oncologist compared lesions (22) defined on prostatectomy specimens by a pathologist (Groenendaal 2010) • five dominate cancers with the volume greater than 1 cc, and four other smaller ones with a minimum volume of 0.56 cc are able to be detected on MRI • The GTVs of the five dominant cancers delineated on the MRI cover 44-76% and have 62-174% of the pathologically determined tumor volumes 37 Biological Target Volume, Tx Predictor, Dose Panting and Sculpting General Hypothesis: • A tumor target volume could be defined and segmented as multiple biological target subvolumes, which is defined based upon multiple functional imaging, and each of which could have a prognostic factor or predictor for radiation response. • Dose sculpt and paint of multiple biological target subvolumes could lead better outcome. Ling, IJROPB, 2000 38 13
