Childcare Issues 100 (A/B) 6 weeks
advertisement
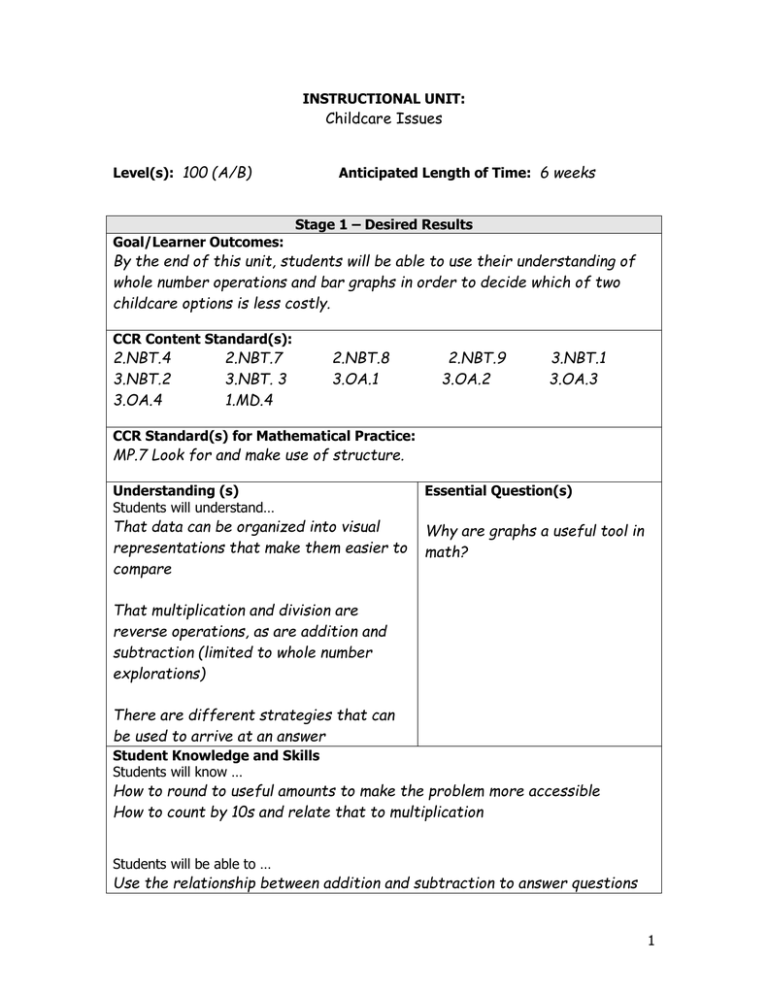
INSTRUCTIONAL UNIT: Childcare Issues Level(s): 100 (A/B) Anticipated Length of Time: 6 weeks Stage 1 – Desired Results Goal/Learner Outcomes: By the end of this unit, students will be able to use their understanding of whole number operations and bar graphs in order to decide which of two childcare options is less costly. CCR Content Standard(s): 2.NBT.4 3.NBT.2 3.OA.4 2.NBT.7 3.NBT. 3 1.MD.4 2.NBT.8 3.OA.1 2.NBT.9 3.OA.2 3.NBT.1 3.OA.3 CCR Standard(s) for Mathematical Practice: MP.7 Look for and make use of structure. Understanding (s) Students will understand… That data can be organized into visual representations that make them easier to compare Essential Question(s) Why are graphs a useful tool in math? That multiplication and division are reverse operations, as are addition and subtraction (limited to whole number explorations) There are different strategies that can be used to arrive at an answer Student Knowledge and Skills Students will know … How to round to useful amounts to make the problem more accessible How to count by 10s and relate that to multiplication Students will be able to … Use the relationship between addition and subtraction to answer questions 1 about data Make statements about data using multiplication and division Organize data in a systematic manner Performance Task(s): Stage 2 – Assessment Evidence Other Evidence: Students will present a report on the results of their review of at least two different childcare situations. Hi-SET-like questions Mental math activities involving multiples of 10 Practice word problems involving the four operations with whole numbers Stage 3 – Learning Plan Learning Activities [some sample lessons without detail or specific organization – this is not an exhaustive list of lessons to be used in this unit] Classroom discussion on childcare issues, including criteria that students think are important in making decisions about childcare Exploring multiples of 10 and comparing those multiples to addition, multiplication, and division Collect survey data with two categories and plot of a frequency graph; also collect data over time about attendance and continue to build a pictograph of the results. Compare bar heights to make general statements about data 2
