Exploring Spatio-Temporal Data as Personal Routes

Exploring Spatio-Temporal Data as Personal Routes
Alex Godwin, Anand Sainath, Sanjay Obla Jayakumar, Vivek Nabhi, Sagar Raut, John Stasko
Georgia Institute of Technology, Atlanta, Georgia, United States
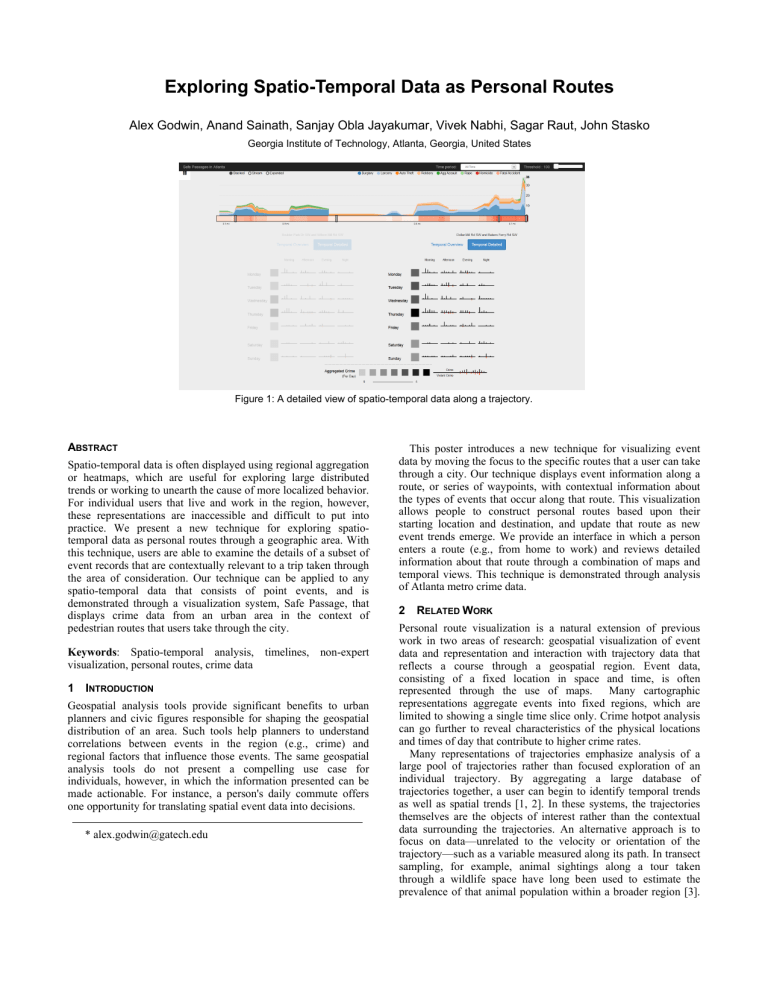
Figure 1: A detailed view of spatio-temporal data along a trajectory.
A BSTRACT
Spatio-temporal data is often displayed using regional aggregation or heatmaps, which are useful for exploring large distributed trends or working to unearth the cause of more localized behavior.
For individual users that live and work in the region, however, these representations are inaccessible and difficult to put into practice. We present a new technique for exploring spatiotemporal data as personal routes through a geographic area. With this technique, users are able to examine the details of a subset of event records that are contextually relevant to a trip taken through the area of consideration. Our technique can be applied to any spatio-temporal data that consists of point events, and is demonstrated through a visualization system, Safe Passage, that displays crime data from an urban area in the context of pedestrian routes that users take through the city.
Keywords : Spatio-temporal analysis, timelines, non-expert visualization, personal routes, crime data
1 I NTRODUCTION
Geospatial analysis tools provide significant benefits to urban planners and civic figures responsible for shaping the geospatial distribution of an area. Such tools help planners to understand correlations between events in the region (e.g., crime) and regional factors that influence those events. The same geospatial analysis tools do not present a compelling use case for individuals, however, in which the information presented can be made actionable. For instance, a person's daily commute offers one opportunity for translating spatial event data into decisions.
* alex.godwin@gatech.edu
This poster introduces a new technique for visualizing event data by moving the focus to the specific routes that a user can take through a city. Our technique displays event information along a route, or series of waypoints, with contextual information about the types of events that occur along that route. This visualization allows people to construct personal routes based upon their starting location and destination, and update that route as new event trends emerge. We provide an interface in which a person enters a route (e.g., from home to work) and reviews detailed information about that route through a combination of maps and temporal views. This technique is demonstrated through analysis of Atlanta metro crime data.
2 R ELATED W ORK
Personal route visualization is a natural extension of previous work in two areas of research: geospatial visualization of event data and representation and interaction with trajectory data that reflects a course through a geospatial region. Event data, consisting of a fixed location in space and time, is often represented through the use of maps. Many cartographic representations aggregate events into fixed regions, which are limited to showing a single time slice only. Crime hotpot analysis can go further to reveal characteristics of the physical locations and times of day that contribute to higher crime rates.
Many representations of trajectories emphasize analysis of a large pool of trajectories rather than focused exploration of an individual trajectory. By aggregating a large database of trajectories together, a user can begin to identify temporal trends as well as spatial trends [1, 2]. In these systems, the trajectories themselves are the objects of interest rather than the contextual data surrounding the trajectories. An alternative approach is to focus on data—unrelated to the velocity or orientation of the trajectory—such as a variable measured along its path. In transect sampling, for example, animal sightings along a tour taken through a wildlife space have long been used to estimate the prevalence of that animal population within a broader region [3].
Visualization techniques have been proposed for representing similar tours through a space in which data, such as radiation along the Tokyo-Fukushima highway, is collected by sampling along a path or computed based upon changes in the path over time [4]. These approaches, however, are still based on an approach in which movement data is used to infer generalizable principles about the region, rather than using a path as a query for exploring known data about a region.
3 P
ERSONAL
R
OUTE
V
ISUALIZATION
First, we compose a transect that includes only the relevant spatial events within the region. We then construct a trajectory between two endpoints consisting of an origin and a destination. Then, the trajectory is subdivided into constituent spatial event waypoints at regular intervals. A user-specified sampling distance is then used to sample a subset of the spatial event data points from each waypoint location along the trajectory, reducing the number of events under consideration to only those that are near the trajectory. The sampled spatial events are then associated with the waypoints that they occur in proximity to. Once the associations between spatial events and waypoints have been made, the transect can then be characterized by these associations in space and time.
3.1 Route View
We construct a personal route that can be used to navigate from one location to another. A subset of optimal trajectories are generated using a directions service (e.g., Google Maps API), that conform to the constraints provided by the user. A map-based representation is displayed of the routes (Figure 2). The spatial event data is sampled at major waypoint milestones (turns and street changes). The result is a node-link diagram in which the nodes represent the waypoints and the links are used to connect nodes that are located within the same route. The area of each node along the route is used to indicate the number of spatial events that occur within the sampled area of that waypoint. The location of each node roughly conforms to the original position of the waypoint on the map, but has been perturbed by a forcedirected layout to avoid over-plotting of the node ellipses.
Figure 2: Route view showing both a map-based display of the true route and a simplified node-link view of the crime that occurs at each of the major waypoints.
3.2 Timeline View
A timeline view displays the changes in spatial event prevalence over the course of the selected route (Figure 1). The default and starting layout of the timeline is stacked area chart in which the xaxis represents the distance from the origin and the y-axis represents the amount of event occurrence. Along the bottom of the stacked area chart, a secondary visualization has been added in which vertical markers are placed along the axis in the corresponding location for each of the major waypoints along the route (e.g., turn locations). These markers are embedded in a reinforcing heatmap in which the saturation is higher in regions where the spatial events are more prevalent. Hovering the mouse over a waypoint markers provides a tooltip for the turn guidance provided by the directions service API (e.g., “Turn Left onto Main
St SE”).
3.3 Detailed Temporal View
While the timeline along the top of the screen is useful for understanding the historical context of all spatial events that have occurred along the transect of the route, the types of event present can vary significantly depending on when you depart. A temporal view is generated for each of the alternate routes displayed in the route view. These temporal views are arranged along the bottom of the screen (Figure 1). The currently selected route is emphasized by reducing the opacity of the other temporal views.
In these temporal views, the times of day are displayed as timelines that depict the relative prevalence of events depending on when the user takes the trip. Bars indicate the prevalence of events in general through height, while a red-shaded bar underneath each axis reflects the prevalence of incidents of high interest (e.g., violent crime prevalence).
4 F
UTURE
W
ORK
There are two primary areas of future work that could extend the techniques described in this paper. First, the distinction between expert and non-expert tasks could be further examined with respect to the types of tasks that personal routes could support for experts. One method for accomplishing this would be to modify the existing transect construction technique so that the distance from the spatial event to either the waypoint or trajectory are taken into account to create a more nuanced model than the current sampled count of the proximal spatial events. Second, our technique could be applied to additional data sets to better establish the domains in which it provides value. We have begun to explore automobile accident records within the context of personal routes, and have seen some initial success in displaying the areas along a trajectory in which accidents occur more frequently.
5 A CKNOWLEDGEMENTS
The authors wish to the Atlanta Police Department for providing the open data sources used in the case studies. Support for the research provided by the National Science Foundation (CCF-
0808863) and the DHS VACCINE Center of Excellence.
R
EFERENCES
[1] Gennady Andrienko and Natalia Andrienko, "Spatio-temporal aggregation for visual analysis of movements," in Visual Analytics
Science and Technology (VAST '08) , Columbus, Ohio, 2008, pp. 51-
58.
[2] Gennady Andrienko, Natalia Andrienko, and Stefan Wrobel, "Visual
Analytics tools for analysis of movement data," ACM SIGKDD
Explorations Newsletter , vol. 9, no. 2, pp. 38-46, 2007.
[3] Stephen T Buckland, David R Anderson, Kenneth P Burnham, and
Jeffrey L Laake, Distance Sampling .: John Wiley & Sons, 2005.
[4] Christian Tominski, Heidrun Schumann, Gennady Andrienko, and
Natalia Andrienko, "Stacking-based visualization of trajectory attribute data," IEEE Transactions on Visualization and Computer
Graphics , vol. 18, no. 12, pp. 2565-2574, 2012.


