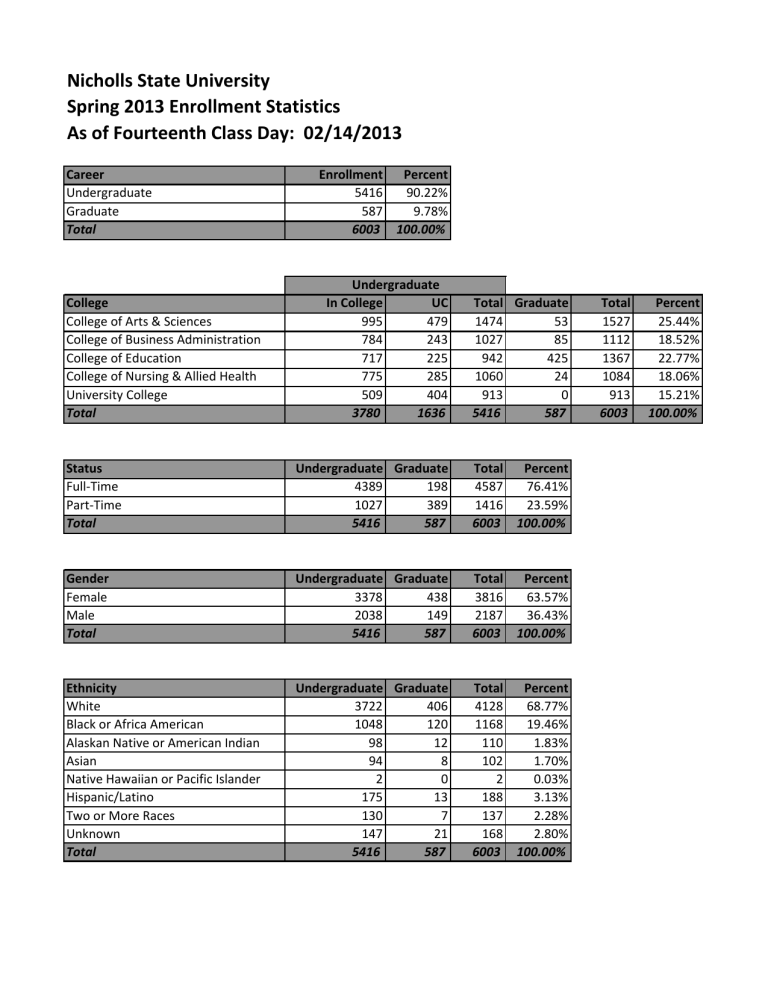
Nicholls State University Spring 2013 Enrollment Statistics As of Fourteenth Class Day: 02/14/2013
advertisement

Nicholls State University Spring 2013 Enrollment Statistics As of Fourteenth Class Day: 02/14/2013 Career Undergraduate Graduate Total Enrollment Percent 5416 90.22% 587 9.78% 6003 100.00% Undergraduate In College UC 995 479 784 243 717 225 775 285 509 404 3780 1636 Total Graduate 1474 53 1027 85 942 425 1060 24 913 0 5416 587 Status Full‐Time Part‐Time Total Undergraduate Graduate 4389 198 1027 389 5416 587 Total Percent 4587 76.41% 1416 23.59% 6003 100.00% Gender Female Male Total Undergraduate Graduate 3378 438 2038 149 5416 587 Total Percent 3816 63.57% 2187 36.43% 6003 100.00% Ethnicity White Black or Africa American Alaskan Native or American Indian Asian Native Hawaiian or Pacific Islander Hispanic/Latino Two or More Races Unknown Total Undergraduate Graduate 3722 406 1048 120 98 12 94 8 2 0 175 13 130 7 147 21 5416 587 Total Percent 4128 68.77% 1168 19.46% 110 1.83% 102 1.70% 2 0.03% 188 3.13% 137 2.28% 168 2.80% 6003 100.00% College College of Arts & Sciences College of Business Administration College of Education College of Nursing & Allied Health University College Total Total 1527 1112 1367 1084 913 6003 Percent 25.44% 18.52% 22.77% 18.06% 15.21% 100.00% Nicholls State University Spring 2013 Enrollment Statistics As of Fourteenth Class Day: 02/14/2013 Entry Status First‐Time Continuing New Transfer Re‐Entry Visitor Status Early Admissions Cross Enrolled Total Undergraduate Graduate 55 105 4748 455 153 0 242 25 30 2 142 0 46 0 5416 587 Total Percent 160 2.67% 5203 86.67% 153 2.55% 267 4.45% 32 0.53% 142 2.37% 46 0.77% 6003 100.00% Age Under 18 18 ‐ 19 20 ‐ 21 22 ‐ 24 25 ‐ 29 30 ‐ 34 35 ‐ 39 40 ‐ 49 50 ‐ 64 Over 64 Total Undergraduate Graduate 119 0 1564 0 1604 11 1131 160 454 180 256 95 109 57 134 69 40 15 5 0 5416 587 Total Percent 119 1.98% 1564 26.05% 1615 26.90% 1291 21.51% 634 10.56% 351 5.85% 166 2.77% 203 3.38% 55 0.92% 5 0.08% 6003 100.00% Residency Louisiana Texas Arkansas Mississippi Other States and US Possessions Foreign Countries Total Undergraduate Graduate 5074 503 67 5 2 2 33 4 116 41 124 32 5416 587 Total Percent 5577 92.90% 72 1.20% 4 0.07% 37 0.62% 157 2.62% 156 2.60% 6003 100.00% Nicholls State University Spring 2013 Enrollment Statistics As of Fourteenth Class Day: 02/14/2013 College Arts & Sciences Total Business Administration Total Education Total Nursing & Allied Health Total University College Total University Totals Department Art Biology Government and Social Sciences Graduate Studies History & Geography Languages & Literature Mass Communication Math Applied Sciences Music Physical Sciences Accounting & Information Systems Graduate Studies Management & Marketing Graduate Studies Psychology & Counselor Education Teacher Education Allied Health Sciences Nursing Interdisciplinary Studies John Folse Culinary Institute Undergraduate In College UC 107 42 244 161 71 31 Total 149 405 102 Graduate 53 55 67 109 36 253 33 20 995 350 13 11 48 20 117 21 15 479 101 68 78 157 56 370 54 35 1474 451 53 85 434 784 142 243 576 1027 272 445 717 243 532 775 326 183 509 109 116 225 79 206 285 328 76 404 381 561 942 322 738 1060 654 259 913 3780 1636 5416 85 425 425 24 24 587 Total 149 405 102 53 68 78 157 56 370 54 35 1527 451 85 576 1112 425 381 561 1367 322 762 1084 654 259 913 6003 Nicholls State University Spring 2013 Enrollment Statistics As of Fourteenth Class Day: 02/14/2013 College Arts & Sciences Department Art Biology Government and Social Sciences Graduate Studies History & Geography Languages & Literature Major Art K‐12 Art Education Agricultural Business ‐ Production Biology Biology ‐ Microbiology Biology ‐ Pre‐Medicine/Pre‐Dentistry Biology ‐ Environmental Biology Biology ‐ Marine Biology Biology ‐ Pre‐Occupational Therapy Biology ‐ Pre‐Physical Therapy Biology ‐ Pre‐Medical Technology Biology ‐ Pre‐Veterinary Medicine Biology ‐ Pre‐Clinical Lab Sci Biology ‐ Pre‐Dental Hygiene Biology ‐ Pre‐Physician Assistant Biology ‐ Pre‐Pharmacy Biology ‐ Cell & Molecular Bio Pre‐Physician Assistant Program Government Sociology Sociology ‐ Family/Youth Advocacy Sociology ‐ NO Community/Technical College Mathematics Marine & Environmental Biology Non‐Degree Holding a Bachelor Degree History History ‐ NO English Undergraduate In College UC Total Graduate 100 39 139 7 3 10 1 0 1 21 10 31 8 3 11 103 64 167 8 5 13 25 13 38 5 3 8 18 23 41 1 0 1 13 12 25 3 0 3 13 7 20 4 3 7 20 16 36 0 2 2 1 0 1 21 11 32 34 13 47 13 6 19 3 1 4 29 21 3 53 12 65 2 1 3 25 25 Total 139 10 1 31 11 167 13 38 8 41 1 25 3 20 7 36 2 1 32 47 19 4 29 21 3 65 3 25 College Arts & Sciences cont. Department Languages & Literature cont. Mass Communication Math & Computer Science Applied Sciences Music Physical Sciences Business Administration Accounting & Information Systems Graduate Studies Management & Marketing Major English ‐ Creative Writing English ‐ Literary Studies English ‐ Technical/Professional Writing English ‐ Writing and Thetoric Mass Communication ‐ Broadcast Journalism Mass Communication ‐ Print Journalism Mass Communications ‐ Public Relations Mathematics Mathematics ‐ Computer Science Mathetics ‐ Advanced Mathematics Mathematics ‐ Math Education Petroleum Services ‐ Associate Petroleum Services ‐ Bachelor Petroleum Services ‐ Exploration Prod Petroleum Services ‐ Safety Tech Safety Technology ‐ Associate Geomatics Pre‐Engineering Music Music ‐ Intrumental Music Education Music ‐ Vocal Music Education Music ‐ Liberal Arts Chemistry ‐ Pre‐Med/Pre‐Dent Chemistry ‐ Professional Chemistry ‐ Pre‐Pharmacy Accounting Computer Information Systems Business Administration ‐ Financial Services Marketing Business Administration ‐ Pre‐Law Finance Business Administration Marketing Undergraduate In College UC Total Graduate 29 8 37 7 2 9 2 0 2 4 1 5 48 25 73 18 7 25 43 16 59 9 0 9 9 5 14 7 5 12 11 10 21 26 13 39 43 5 48 39 20 59 44 24 68 46 18 64 45 9 54 10 28 38 7 0 7 10 11 21 8 3 11 8 7 15 3 9 12 15 6 21 2 0 2 208 47 255 77 27 104 4 1 5 34 16 50 27 10 37 85 49 10 59 Total 37 9 2 5 73 25 59 9 14 12 21 39 48 59 68 64 54 38 7 21 11 15 12 21 2 255 104 5 50 37 85 59 College Department Business Administration cont. Management & Marketing cont. Education Graduate Studies Psychology & Counselor Education Teacher Education Major Marketing ‐ Professional Sales Business Administration Business Administration ‐ Entrepreneurship Business Administration ‐ Multinational Business Management Management ‐ Human Resources Psychological Counseling MA in Teaching ‐ Grades 1 ‐ 5 MA in Teaching ‐ Grades 4 ‐ 8 MA in Teaching ‐ Grades 6‐12 MA in Teaching ‐ HPED in K‐12 Curriculum & Instruction ‐ Early Childhood Counselor Education Curriculum & Instruction ‐ Elementary Education Curriculum & Instruction ‐ Learning Disability Curriculum & Instruction ‐ Secondary Education Curriculum & Instruction ‐ Reading Education Education Leadership ‐ Higher Education Leadership Education Leadership ‐ K‐12 School Leadership Education Leadership ‐ Tech Leadership Education Leadership ‐ Tech Leadership ‐ NO Non‐Degree Holding Bachelor's Degree Non‐Master's Alternative Certification Program Specialist in School Psychology Psychology General Family and Consumer Science ‐ Social Services General Family and Consumer Science ‐ Social Services ‐ NO Child Development & Preschool Management Elementary Ed ‐ 1‐5 Certification Elementary Ed ‐ 4‐8 Certification Art Education Certification English Education ‐ Primary Certification Undergraduate In College UC Total Graduate 23 3 26 212 90 302 1 0 1 20 3 23 73 23 96 56 13 69 81 21 12 30 3 3 45 5 33 6 17 19 37 1 10 6 68 28 143 67 210 117 40 157 12 2 14 18 2 20 77 18 95 35 9 44 4 0 4 12 0 12 Total 26 302 1 23 96 69 81 21 12 30 3 3 45 5 33 6 17 19 37 1 10 6 68 28 210 157 14 20 95 44 4 12 College Education cont. Department Teacher Education cont. Nursing & Allied Health Allied Health Sciences Nursing University College Interdisciplinary Studies John Folse Culinary Institute Major Social Studies Ed Certification Music Ed ‐ Instrumental Music Certification Music Ed ‐ Vocal Music Certification Birth to Five Early Interventionist Education Business Ed Primary Certification Family & Consumer Science Education General Science Ed ‐ Primary Certification Human Performance Education Mathematics Education ‐ Primary Certification Elementary Ed ‐ PK‐3 Certification Secondary Education ‐ Social Studies Secondary Education ‐ General Science Secondary Education ‐ Family and Consumer Science Secondary Education ‐ English Health Sciences ‐ Pre‐Professional Health Sciences ‐ Supervision & Management Athletic Training Communicative Disorders Dietetics Nursing (Bachelor) Nursing (MSN) ‐ Fmly Psyc/Mntl Nursing (MSN) ‐ Practitioner Nursing ‐ NO (Bachelor) General Studies (Associate) General Studies (Bachelor) General Studies ‐ NO (Bachelor) Dual Enrolled (High School Students) Undecided Culinary Arts (Associate) Culinary Arts (Bachelor) Culinary Arts ‐ Culinary Operations Culinary Arts ‐ Pâtisserie Undergraduate In College UC Total Graduate 24 0 24 8 0 8 1 0 1 99 16 115 2 0 2 4 0 4 5 0 5 40 13 53 4 0 4 70 31 101 17 11 28 8 1 9 4 1 5 13 14 27 41 24 65 18 1 19 51 31 82 57 12 69 76 11 87 521 206 727 1 23 11 0 11 16 15 31 282 91 373 21 12 33 3 138 141 4 72 76 12 7 19 115 3 118 9 6 15 19 18 37 Total 24 8 1 115 2 4 5 53 4 101 28 9 5 27 65 19 82 69 87 727 1 23 11 31 373 33 141 76 19 118 15 37 College University College cont. University Totals ** NO = Nicholls Online Department John Folse Culinary Institute cont. Major Culinary Arts ‐ Professional Culinary Arts ‐ Research & Development Culinary Arts ‐ Service Undergraduate In College UC Total Graduate 19 35 54 4 5 9 5 2 7 3780 1636 5416 587 Total 54 9 7 6003 Nicholls State University Spring 2013 Enrollment Statistics As of Fourteenth Class Day: 02/14/2013 NUMBER OF NUMBER OF MASTERS SEMESTER UNDERGRADUATE SEMESTER HOURS ON (1) (2) (3) (4) HOURS ON SCHEDULE STUDENTS SCH STUDENTS SCH SCHEDULE 0 4 0 2 0 0 1 5 5 1 1 1 2 4 8 0 0 2 177 531 91 273 3 3 12 48 0 0 4 4 37 185 1 5 5 5 244 1,464 285 1,710 6 6 64 448 4 28 7 7 20 160 5 40 8 8 269 2,421 134 1,206 9 9 132 1,320 4 40 10 10 59 649 4 44 11 11 923 11,076 54 648 12 12 459 5,967 0 0 13 13 314 4,396 0 0 14 14 1,296 19,440 2 30 15 15 16 441 7,056 0 0 16 17 292 4,964 0 0 17 18 569 10,242 0 0 18 19 45 855 0 0 19 20 18 360 0 0 20 21 28 588 0 0 21 22 3 66 0 0 22 23 1 23 0 0 23 TOTAL 5,416 72,272 587 4,025 TOTAL


