Commodity Data Sheet Sheep, Lambs, and Wool August 1997
advertisement
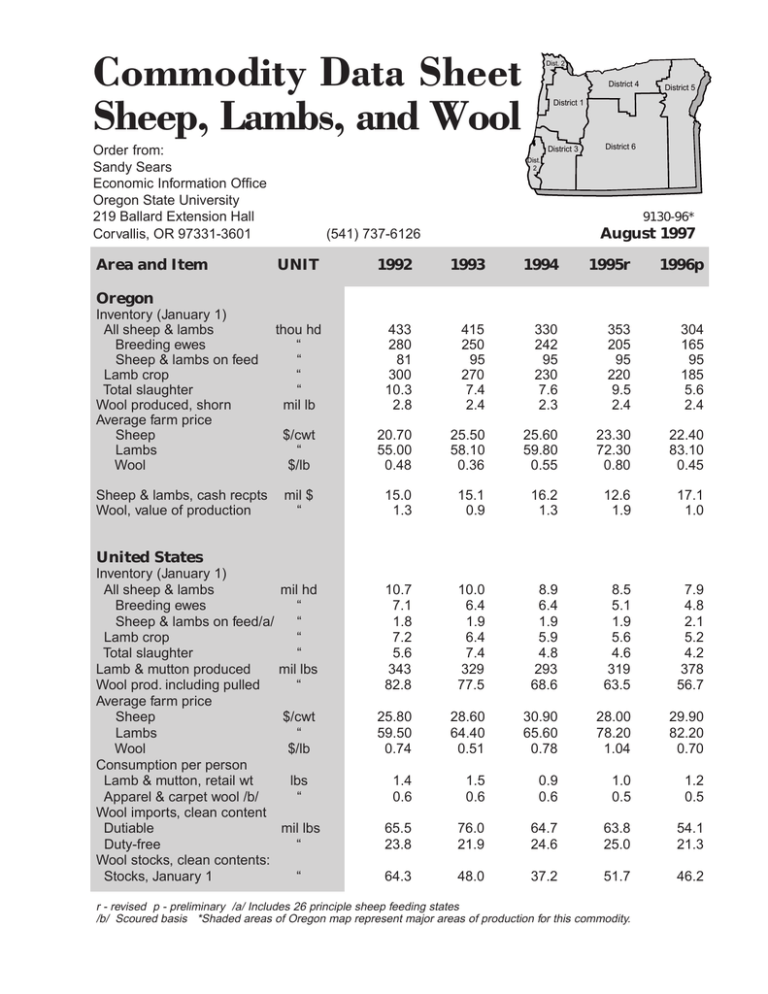
Commodity Data Sheet Sheep, Lambs, and Wool Order from: Sandy Sears Economic Information Office Oregon State University 219 Ballard Extension Hall Corvallis, OR 97331-3601 Area and Item Dist. 2 District 4 District 5 District 1 District 3 District 6 Dist. 2 9130-96* August 1997 (541) 737-6126 UNIT 1992 1993 1994 1995r 1996p thou hd “ “ “ “ mil lb 433 280 81 300 10.3 2.8 415 250 95 270 7.4 2.4 330 242 95 230 7.6 2.3 353 205 95 220 9.5 2.4 304 165 95 185 5.6 2.4 $/cwt “ $/lb 20.70 55.00 0.48 25.50 58.10 0.36 25.60 59.80 0.55 23.30 72.30 0.80 22.40 83.10 0.45 mil $ “ 15.0 1.3 15.1 0.9 16.2 1.3 12.6 1.9 17.1 1.0 mil hd “ “ “ “ mil lbs “ 10.7 7.1 1.8 7.2 5.6 343 82.8 10.0 6.4 1.9 6.4 7.4 329 77.5 8.9 6.4 1.9 5.9 4.8 293 68.6 8.5 5.1 1.9 5.6 4.6 319 63.5 7.9 4.8 2.1 5.2 4.2 378 56.7 $/cwt “ $/lb 25.80 59.50 0.74 28.60 64.40 0.51 30.90 65.60 0.78 28.00 78.20 1.04 29.90 82.20 0.70 1.4 0.6 1.5 0.6 0.9 0.6 1.0 0.5 1.2 0.5 mil lbs “ 65.5 23.8 76.0 21.9 64.7 24.6 63.8 25.0 54.1 21.3 “ 64.3 48.0 37.2 51.7 46.2 Oregon Inventory (January 1) All sheep & lambs Breeding ewes Sheep & lambs on feed Lamb crop Total slaughter Wool produced, shorn Average farm price Sheep Lambs Wool Sheep & lambs, cash recpts Wool, value of production United States Inventory (January 1) All sheep & lambs Breeding ewes Sheep & lambs on feed/a/ Lamb crop Total slaughter Lamb & mutton produced Wool prod. including pulled Average farm price Sheep Lambs Wool Consumption per person Lamb & mutton, retail wt Apparel & carpet wool /b/ Wool imports, clean content Dutiable Duty-free Wool stocks, clean contents: Stocks, January 1 lbs “ r - revised p - preliminary /a/ Includes 26 principle sheep feeding states /b/ Scoured basis *Shaded areas of Oregon map represent major areas of production for this commodity. ALL SHEEP AND LAMBS, ON OREGON FARMS. January 1, by counties Dist.-County & State Benton Clackamas Lane Linn Marion Multnomah Polk Washington Yamhill District 1 1960 1970 number of head 1993 1994 1995r number of head 1996p 31,000 37,000 39,000 62,000 43,000 2,700 30,500 6,000 28,000 279,200 16,000 22,000 28,000 50,000 28,000 1,400 24,000 5,800 17,000 192,200 7,000 11,000 23,000 67,000 13,000 900 12,500 2,000 11,500 147,900 7,200 12,000 25,000 70,000 13,000 900 13,000 2,200 11,500 154,800 5,900 8,700 20,900 59,600 12,100 600 10,900 1,500 9,100 129,300 6,330 9,520 21,220 59,840 12,120 700 11,090 1,730 9,520 132,070 Clatsop Columbia Coos Curry Lincoln Tillamook District 2 800 7,500 23,500 32,000 5,800 1,200 70,800 500 5,500 23,000 22,000 3,500 400 54,900 900 1,500 28,500 26,500 4,000 300 61,700 800 1,400 28,000 25,000 3,500 200 58,900 700 1,000 24,300 21,200 2,600 200 50,000 700 1,040 24,250 22,520 3,300 90 51,900 Douglas Jackson Josephine District 3 116,000 11,000 1,600 128,600 99,000 4,000 1,500 104,500 75,000 5,500 1,000 81,500 72,000 5,000 1,000 78,000 65,200 4,200 900 70,300 66,720 4,060 860 71,640 Gilliam Hood River Morrow Sherman Umatilla Wasco Wheeler District 4 12,500 700 34,000 2,000 47,000 27,500 22,000 145,700 7,700 300 11,000 200 46,000 9,000 6,700 80,900 200 300 14,500 100 34,000 700 3,000 52,800 200 300 16,000 100 34,000 700 3,200 54,500 200 300 14,300 100 29,900 600 2,800 48,200 170 260 14,290 90 29,440 600 1,560 46,410 Baker Malheur Union Wallowa District 5 34,500 58,000 8,500 34,000 135,000 18,000 10,000 4,500 22,000 54,500 5,000 13,500 2,500 8,000 29,000 5,000 13,500 2,300 11,000 31,800 3,700 11,700 2,000 7,900 25,300 3,680 11,690 2,000 5,030 22,400 Crook Deschutes Grant Harney Jefferson Klamath Lake District 6 12,200 7,000 8,000 21,500 13,000 60,000 35,000 156,700 2,000 3,000 2,000 9,000 2,000 33,000 3,000 54,000 3,600 4,000 1,300 6,400 10,500 14,000 2,300 42,100 3,700 4,000 1,300 7,000 10,500 14,000 1,500 42,000 2,600 3,300 1,100 5,700 6,500 9,600 1,100 29,900 2,250 3,290 860 5,810 7,010 8,660 700 28,580 State Total 916,000 541,000 415,000 420,000 353,000 353,000 r - revised. p - preliminary. VALUE OF SHEEP & LAMBS SOLD, by Counties, OREGON Dist.-County & State 1991 1992 1993 1994 1995r 1996p thousand dollars Benton Clackamas Lane Linn Marion Multnomah Polk Washington Yamhill District 1 280 397 674 1,945 558 24 469 81 380 4,808 262 420 800 2,050 520 32 484 84 410 5,062 327 505 930 2,572 648 38 573 85 490 6,168 331 616 948 2,598 759 43 654 95 493 6,537 276 421 704 2,025 607 28 494 73 372 5,000 273 517 668 1,925 583 38 464 87 385 4,940 Clatsop Columbia Coos Curry Lincoln Tillamook District 2 23 53 1,040 906 140 8 2,170 20 48 1,130 970 135 7 2,310 33 55 1,064 877 123 8 2,160 41 57 1,091 967 133 6 2,295 28 42 1,045 797 97 5 2,014 27 40 933 749 120 5 1,874 Douglas Jackson Josephine District 3 2,665 204 38 2,907 2,910 210 32 3,152 2,644 194 35 2,873 2,608 209 43 2,860 2,086 154 33 2,273 3,679 169 34 3,882 Gilliam Hood River Morrow Sherman Umatilla Wasco Wheeler District 4 6 14 566 2 2,405 25 146 3,164 4 14 625 3 2,465 31 115 3,257 5 14 506 3 2,718 33 150 3,429 6 14 588 4 2,750 33 171 3,566 5 9 657 3 2,444 21 117 3,256 4 8 630 4 2,345 25 73 3,089 Baker Malheur Union Wallowa District 5 154 372 159 466 1,151 149 359 98 255 861 181 472 106 370 1,129 199 474 104 512 1,289 144 424 85 292 945 126 626 82 241 1,075 Crook Deschutes Grant Harney Jefferson Klamath Lake District 6 134 184 42 139 343 668 130 1,640 180 165 45 195 376 672 95 1,728 199 224 60 194 395 663 106 1,841 209 237 66 256 455 664 66 1,953 121 160 53 174 319 414 47 1,288 101 146 48 229 388 358 55 1,325 State Total 15,840 16,370 17,600 18,500 14,776 16,185 r - revised. p - preliminary. SOURCE: Extension Economic Information Office, Oregon State University Sheep and Lambs Production, Marketings, Price, and Value, Oregon. 1940-1996p Year /a/ Total Production mktgs ———mil. lbs.——— Sheep Lambs ———dollars——— Value Cash of home Gross recpts consumpincome ——————mil. dollars—— 1940 1950 1955 77,564 37,090 52,471 75,624 40,260 52,181 3.75 9.50 5.50 7.50 23.00 17.00 5,330 8,861 8,640 66 79 56 5,396 8,940 8,696 1960 1961 1962 1963 1964 51,334 50,209 46,091 44,421 38,442 55,389 62,164 56,941 52,676 47,112 4.40 3.80 4.60 4.80 4.40 17.00 14.70 17.50 18.00 19.70 8,508 7,857 8,812 8,355 8,241 73 66 68 84 76 8,581 7,923 8,880 8,439 8,317 1965 1966 1967 1968 1969 36,165 36,062 33,873 33,575 25,530 45,470 44,772 40,914 33,693 32,840 5.10 5.70 5.20 5.70 6.70 21.10 22.60 21.60 23.90 26.20 8,448 8,510 7,735 7,489 6,746 84 70 70 82 136 8,532 8,580 7,805 7,571 7,935 1970 1971 1972 1973 1974 30,051 28,632 28,937 30,504 29,176 35,852 29,755 36,910 27,454 38,404 5.80 5.60 6.60 13.90 9.00 25.10 25.60 27.30 33.20 32.50 8,149 6,760 8,462 8,639 11,229 138 122 111 296 341 8,287 6,882 8,573 8,935 11,570 1975 1976 1977 1978 1979 26,070 26,741 23,544 24,811 25,388 31,506 31,923 21,520 19,536 25,993 9.70 12.30 11.40 16.70 17.70 40.50 43.20 49.80 61.40 62.70 10,720 12,264 10,517 11,995 13,314 510 454 523 501 537 11,230 12,718 11,040 12,496 13,851 1980 1981 1982 1983 1984 26,166 32,528 30,044 24,154 26,691 22,708 27,674 33,535 28,254 30,696 13.70 15.70 13.20 11.30 12.70 60.40 54.40 51.90 50.20 56.80 12,501 14,381 14,432 11,803 16,333 476 680 884 507 477 12,977 15,061 15,316 12,310 16,810 1985 1986 1987 1988 1989 27,240 27,287 34,465 29,395 32,060 28,778 28,605 27,478 31,930 37,338 19.90 18.60 23.30 20.30 19.30 65.60 65.90 75.80 62.30 64.80 17,221 16,545 19,385 18,895 22,091 379 670 1,043 358 711 17,600 17,215 20,428 19,253 22,802 1990 1991 1992 1993 1994 30,655 32,940 30,195 27,370 22,110 28,359 35,230 32,749 29,605 32,240 17.50 16.00 20.70 25.50 25.60 51.80 47.40 55.00 58.10 59.80 13,618 14,972 14,894 15,122 16,159 391 408 215 535 718 14,009 15,380 15,183 15,657 16,876 1995r 1996p 21,905 20,525 18,270 26,275 23.30 22.40 72.30 83.10 12,597 17,054 868 997 13,465 18,051 r - revised. p - preliminary /a/ Adjustments made for changes in inventory and for inshipments SOURCE: Compiled by Extension Economic Information Office, Oregon State University, from USDA and other government reports. Oregon State University Extension Service offers educational programs, activities, and materials--without regard to race, color, national origin, sex, age, or disability--as required by the Title VI of Civil Rights Act of 1964, Title IX of the Education Amendments of 1972, and Section 504 of the Rehabilitation Act of 1973. Oregon State University Extension Service is an Equal Opportunity Employer.
