Benton 56,114 60,644 72,404
advertisement
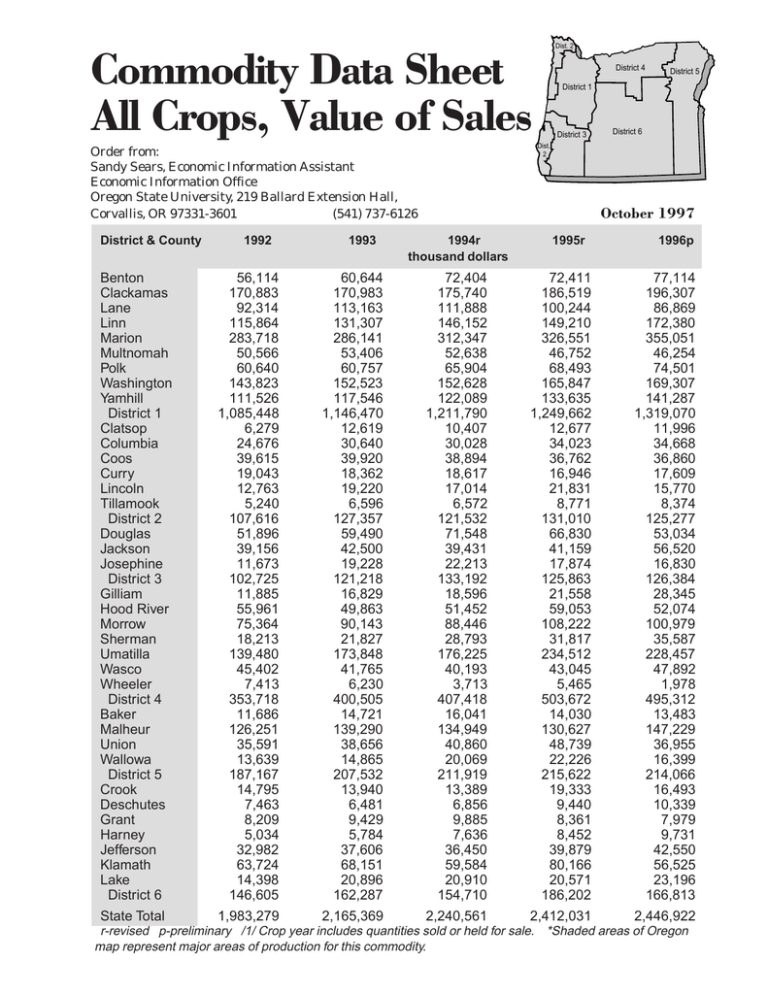
Commodity Data Sheet All Crops, Value of Sales Order from: Sandy Sears, Economic Information Assistant Economic Information Office Oregon State University, 219 Ballard Extension Hall, Corvallis, OR 97331-3601 (541) 737-6126 District & County 1992 1993 Dist. 2 District 4 District 5 District 1 District 3 District 6 Dist. 2 October 1997 1994r thousand dollars 1995r 1996p Benton Clackamas Lane Linn Marion Multnomah Polk Washington Yamhill District 1 Clatsop Columbia Coos Curry Lincoln Tillamook District 2 Douglas Jackson Josephine District 3 Gilliam Hood River Morrow Sherman Umatilla Wasco Wheeler District 4 Baker Malheur Union Wallowa District 5 Crook Deschutes Grant Harney Jefferson Klamath Lake District 6 56,114 170,883 92,314 115,864 283,718 50,566 60,640 143,823 111,526 1,085,448 6,279 24,676 39,615 19,043 12,763 5,240 107,616 51,896 39,156 11,673 102,725 11,885 55,961 75,364 18,213 139,480 45,402 7,413 353,718 11,686 126,251 35,591 13,639 187,167 14,795 7,463 8,209 5,034 32,982 63,724 14,398 146,605 60,644 170,983 113,163 131,307 286,141 53,406 60,757 152,523 117,546 1,146,470 12,619 30,640 39,920 18,362 19,220 6,596 127,357 59,490 42,500 19,228 121,218 16,829 49,863 90,143 21,827 173,848 41,765 6,230 400,505 14,721 139,290 38,656 14,865 207,532 13,940 6,481 9,429 5,784 37,606 68,151 20,896 162,287 72,404 175,740 111,888 146,152 312,347 52,638 65,904 152,628 122,089 1,211,790 10,407 30,028 38,894 18,617 17,014 6,572 121,532 71,548 39,431 22,213 133,192 18,596 51,452 88,446 28,793 176,225 40,193 3,713 407,418 16,041 134,949 40,860 20,069 211,919 13,389 6,856 9,885 7,636 36,450 59,584 20,910 154,710 72,411 186,519 100,244 149,210 326,551 46,752 68,493 165,847 133,635 1,249,662 12,677 34,023 36,762 16,946 21,831 8,771 131,010 66,830 41,159 17,874 125,863 21,558 59,053 108,222 31,817 234,512 43,045 5,465 503,672 14,030 130,627 48,739 22,226 215,622 19,333 9,440 8,361 8,452 39,879 80,166 20,571 186,202 77,114 196,307 86,869 172,380 355,051 46,254 74,501 169,307 141,287 1,319,070 11,996 34,668 36,860 17,609 15,770 8,374 125,277 53,034 56,520 16,830 126,384 28,345 52,074 100,979 35,587 228,457 47,892 1,978 495,312 13,483 147,229 36,955 16,399 214,066 16,493 10,339 7,979 9,731 42,550 56,525 23,196 166,813 State Total 1,983,279 2,165,369 2,240,561 2,412,031 2,446,922 r-revised p-preliminary /1/ Crop year includes quantities sold or held for sale. *Shaded areas of Oregon map represent major areas of production for this commodity. MAJOR OREGON CROPS Harvested Acres 1950-1996p Year Wheat Barley Potatoes Hay Mint Ryegrass Onions Green Peas Acres Processed Snap Sweet Beans Corn Acres Sweet Cherries All Pears tons Oregon State University Extension Service offers educational programs, activities, and materials--without regard to race, color, national origin, sex, age, or disability--as required by the Title VI of Civil Rights Act of 1964, Title IX of the Education Amendments of 1972, and Section 504 of the Rehabilitation Act of 1973. Oregon State University Extension Service is an Equal Opportunity Employer. 1950 1955 1960 1965 952,000 824,000 793,000 806,000 337,000 559,000 457,000 369,000 36,500 36,000 34,500 38,500 1,020,000 1,034,000 1,029,000 1,050,000 14,600 13,000 14,300 16,800 129,000 157,000 163,000 142,000 4,600 4,800 5,000 5,500 52,260 59,000 57,200 56,400 6,600 10,500 11,700 21,900 n/a 11,500 21,500 28,800 17,400 31,000 12,800 20,100 135,000 141,475 105,700 153,600 1970 1971 1972 1973 1974 673,000 768,000 879,000 1,032,000 1,264,000 395,000 355,000 250,000 230,000 190,000 53,600 47,500 40,700 41,900 50,000 1,017,000 1,050,000 1,050,000 1,037,000 1,040,000 38,000 33,500 34,500 36,500 35,500 185,000 174,000 173,000 180,000 190,000 6,800 7,000 7,100 7,700 7,500 43,700 39,500 44,800 50,600 43,000 27,700 32,000 35,000 42,000 43,600 29,500 35,000 39,200 40,600 41,400 40,000 32,700 20,000 37,000 33,500 90,000 179,000 110,000 171,000 175,000 1975 1976 1977 1978 1979 1,255,000 1,333,000 1,230,000 1,225,000 1,245,000 177,000 160,000 190,000 185,000 160,000 55,500 65,600 60,000 67,600 63,000 1,040,000 1,050,000 1,025,000 1,075,000 1,060,000 40,000 42,000 51,000 57,000 51,000 180,000 166,000 180,000 202,000 189,000 7,600 8,200 8,700 9,300 9,500 49,100 35,900 27,700 36,900 42,000 32,400 29,300 32,500 35,600 38,400 41,300 39,900 40,900 40,200 37,800 36,500 39,000 37,500 35,000 38,000 170,000 200,000 179,000 151,500 205,000 1980 1981 1982 1983 1984 1,350,000 1,310,000 1,200,000 1,085,000 1,115,000 155,000 195,000 220,000 270,000 280,000 47,000 54,000 52,500 48,500 56,500 1,070,000 1,060,000 1,070,000 1,110,000 1,105,000 45,000 38,000 31,000 33,900 36,800 188,000 184,000 195,650 180,660 181,800 8,700 8,900 10,400 11,100 15,000 32,600 32,300 33,700 34,400 33,600 31,100 27,400 25,700 22,400 23,900 33,700 39,900 45,500 38,800 42,000 31,800 37,000 35,000 42,000 29,500 200,000 202,000 175,000 188,000 150,000 1985 1986 1987 1988 1989 1,065,000 1,025,020 810,000 755,000 920,000 350,000 365,000 200,000 200,000 180,000 61,000 52,000 55,000 45,000 50,000 1,080,000 1,110,000 1,500,000 1,035,000 1,050,000 37,200 36,800 37,000 41,500 48,000 185,000 189,000 201,500 212,500 219,000 13,800 12,000 13,390 14,100 13,800 35,400 29,200 33,300 26,000 34,100 23,200 22,300 20,300 21,700 25,700 38,600 34,900 38,900 38,500 45,500 27,000 38,000 54,000 60,100 50,000 193,000 162,000 228,060 213,080 215,200 968,000 846,000 925,000 925,000 928,000 130,000 175,000 150,000 130,000 130,000 53,000 50,000 45,000 49,400 55,800 1,020,000 1,075,000 925,000 1,040,000 1,012,200 47,900 49,500 49,500 45,100 45,700 223,240 216,800 216,000 229,440 254,540 14,200 15,150 16,600 19,000 21,400 34,900 35,500 39,400 33,900 36,500 25,667 24,200 22,500 22,100 23,000 49,500 50,100 45,700 44,800 47,300 40,000 39,000 52,000 34,000 39,620 233,360 220,350 214,680 223,460 258,630 1995r 904,000 95,000 53,200 1996p 955,000 150,000 60,550 r - revised p - preliminary n/a Not available 1,099,910 1,070,000 52,000 51,600 265,650 261,130 19,100 18,300 33,700 22,620 23,600 22,500 48,900 48,300 30,318 29,730 230,030 185,066 1990 1991 1992 1993 1994r
