Proceedings of the Twenty-Second Innovative Applications of Artificial Intelligence Conference (IAAI-10)
Natural Language Aided Visual Query Building for Complex Data Access
Shimei Pan
Michelle Zhou
Keith Houck
Peter Kissa
IBM T. J. Watson Research Center
19 Skyline Drive, Hawthorne, NY 10532
{shimei, mzhou, khouck, pkissa}@us.ibm.com
Abstract
Over the past decades, there have been significant efforts on
developing robust and easy-to-use query interfaces to
databases. So far, the typical query interfaces are GUIbased visual query interfaces. Visual query interfaces
however, have limitations especially when they are used for
accessing large and complex datasets. Therefore, we are
developing a novel query interface where users can use
natural language expressions to help author visual queries.
Our work enhances the usability of a visual query interface
by directly addressing the “knowledge gap” issue in visual
query interfaces. We have applied our work in several
real-world applications. Our preliminary evaluation
demonstrates the effectiveness of our approach.
Introduction
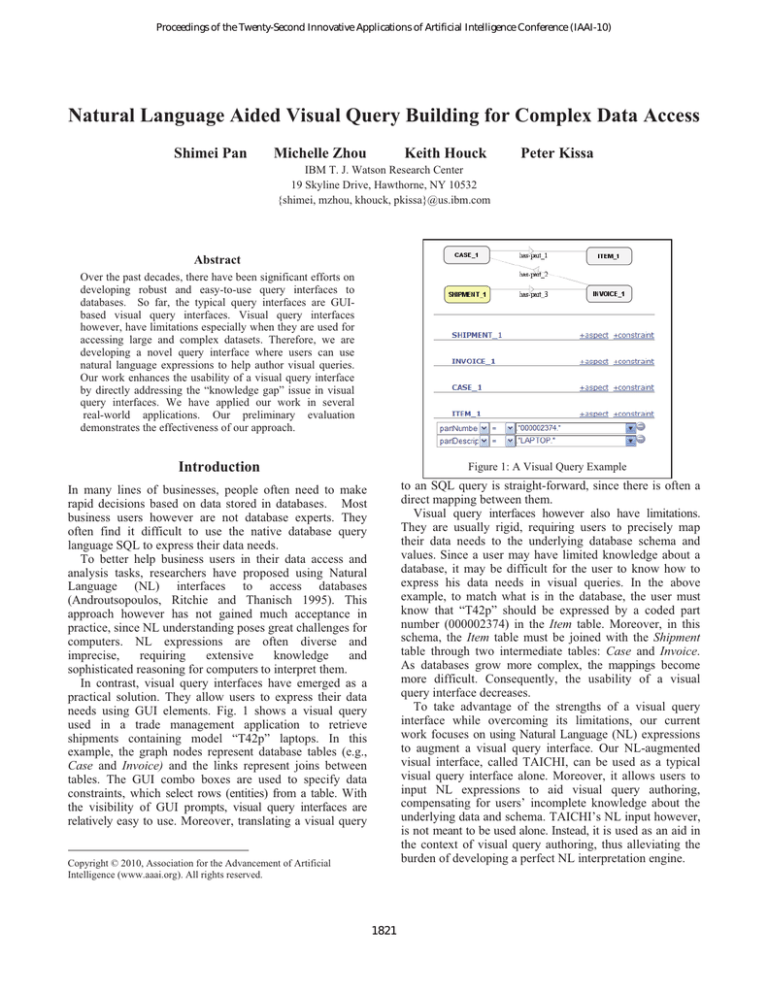
Figure 1: A Visual Query Example
In many lines of businesses, people often need to make
rapid decisions based on data stored in databases. Most
business users however are not database experts. They
often find it difficult to use the native database query
language SQL to express their data needs.
To better help business users in their data access and
analysis tasks, researchers have proposed using Natural
Language (NL) interfaces to access databases
(Androutsopoulos, Ritchie and Thanisch 1995). This
approach however has not gained much acceptance in
practice, since NL understanding poses great challenges for
computers. NL expressions are often diverse and
imprecise,
requiring
extensive
knowledge
and
sophisticated reasoning for computers to interpret them.
In contrast, visual query interfaces have emerged as a
practical solution. They allow users to express their data
needs using GUI elements. Fig. 1 shows a visual query
used in a trade management application to retrieve
shipments containing model “T42p” laptops. In this
example, the graph nodes represent database tables (e.g.,
Case and Invoice) and the links represent joins between
tables. The GUI combo boxes are used to specify data
constraints, which select rows (entities) from a table. With
the visibility of GUI prompts, visual query interfaces are
relatively easy to use. Moreover, translating a visual query
to an SQL query is straight-forward, since there is often a
direct mapping between them.
Visual query interfaces however also have limitations.
They are usually rigid, requiring users to precisely map
their data needs to the underlying database schema and
values. Since a user may have limited knowledge about a
database, it may be difficult for the user to know how to
express his data needs in visual queries. In the above
example, to match what is in the database, the user must
know that “T42p” should be expressed by a coded part
number (000002374) in the Item table. Moreover, in this
schema, the Item table must be joined with the Shipment
table through two intermediate tables: Case and Invoice.
As databases grow more complex, the mappings become
more difficult. Consequently, the usability of a visual
query interface decreases.
To take advantage of the strengths of a visual query
interface while overcoming its limitations, our current
work focuses on using Natural Language (NL) expressions
to augment a visual query interface. Our NL-augmented
visual interface, called TAICHI, can be used as a typical
visual query interface alone. Moreover, it allows users to
input NL expressions to aid visual query authoring,
compensating for users’ incomplete knowledge about the
underlying data and schema. TAICHI’s NL input however,
is not meant to be used alone. Instead, it is used as an aid in
the context of visual query authoring, thus alleviating the
burden of developing a perfect NL interpretation engine.
Copyright © 2010, Association for the Advancement of Artificial
Intelligence (www.aaai.org). All rights reserved.
1821
Figure 2: A Query Graph Example
Figure 3: TAICHI Architecture
TAICHI has been used in several real-world
applications, including a real-estate application and a trade
management application. Through out the paper, we use
examples from these applications to illustrate our work.
it is straight-forward to generate an SQL query from a
query graph. Fig. 2 shows a query graph consisting of a
set of nodes and links. Each node represents a data concept
(e.g., house), while each link encodes the relationship
between two data concepts. During SQL query generation,
a data concept is normally mapped to a database table
while a data relationship is mapped to a database join
operation. Each node is associated with a set of data
attributes (e.g., price) and constraints (e.g., style=colonial).
Each data constraint is further represented by an operator
(e.g., “>”) and a set of operands. An operand can either be
a data concept (e.g., school district), a data attribute (e.g.,
style), a constant value (e.g., 5000), or an aggregated data
aspect (e.g., average price).
TAICHI Architecture Fig. 3 shows the architecture of
TAICHI. It has three main components: an NL interpreter,
a visual query composer, and a dispatcher. The NL
interpreter translates NL expressions to query graph
elements. Given a query graph, the visual query composer
automatically generates a new or updates an existing visual
query. The dispatcher communicates with a web client.
To interpret a user query in context, TAICHI relies on
several knowledge sources. For example, it is connected to
a database server to access domain data. It also maintains
application metadata (e.g., semantic dictionary) and
interaction context (e.g., interaction history).
Related Work
There are numerous works on visual query interfaces for
databases (Ahlberg and Shneiderman 1994; Catarci et al.
1997; Derthick, Kolojejchick and Roth 1997). Similar to
these works, TAICHI allows users to directly author a
visual query using GUI widgets. Unlike these works,
TAICHI also allows users to use NL to author a visual
query from scratch or to complete a partial visual query.
There are also significant efforts on developing NL
interfaces to databases (Androutsopoulos, Ritchie and
Thanisch 1995; Blum 1999, Tang and Mooney 2000). Like
these systems, TAICHI is able to understand a user’s NL
inputs and translate them into database queries. Unlike
these systems, which attempt to interpret NL expressions
alone, TAICHI processes a user’s NL expressions in the
narrower context of a visual query. This often constrains the
possible NL interpretations, resulting in higher accuracy.
To the best of our knowledge, there is little work directly
on NL-aided visual query authoring. However, visual query
interfaces were used to assist NL query building. For
example, a menu-based GUI interface was used to guide
users in selecting and composing NL queries (Tennant,
Ross and Thompson 1983). By guiding users to construct
only system-understandable queries, it reduces the NL
interpretation difficulties. However, the system has the same
limitations as a visual query interface, since GUI is the
dominate interaction modality and NL queries are the
results of GUI interactions. Thus, it does not help close
users’ knowledge gap as TAICHI does.
Examples
Here we use concrete examples to illustrate three typical
uses of NL in aiding visual query authoring.
NL-Aided Visual Query Element Authoring
Consider Jane, a potential home buyer, who wants to find
cities in the north, along the Hudson River. To express her
data needs, Jane first creates a city node. She then adds a
city constraint (“region=north” in Fig. 4a). As she proceeds
to add her second city constraint, “along the Hudson
River”, Jane does not know how to express it. So she
leaves the attribute field empty and enters an NL
expression “along Hudson” in the value field of the
constraint combo box (Fig. 4a). Jane then submits the
query. Given this input, TAICHI attempts to create a city
constraint. Since the word “Hudson” is ambiguous,
TAICHI asks Jane to disambiguate it (Fig. 4b). After the
disambiguation, TAICHI completes the GUI Combo box
expressing the city constraint: “subRegion = Hudson River
Shore” (Fig. 4c). In this case, Jane was able to use NL to
TAICHI Overview
Here we provide an overview of TAICHI, starting with its
internal query representation.
Query Representation TAICHI uses a query graph, an
intermediate query representation, to capture the semantics
of a query. This representation can be rendered visually in
the visual query interface. It also defines the scope of
queries TAICHI can process. Thus, a user query that
cannot be mapped to a valid query graph cannot be
processed correctly by TAICHI. Since there is a direct
mapping from query graph elements to database elements,
1822
Figure 4: NL-Aided Visual Element Authoring
author a visual query element (the subRegion constraint)
that she did not know how to express initially.
NL-Aided Partial Visual Query Completion
Continuing the above scenario, Jane now wants to examine
houses located in the cities discovered earlier. To do so, she
first adds a house node, and links the house node to the
previously created city node to constrain the houses to be
located in these cities (Fig. 5a). Two house constraints are
also added to further limit the house set. Moreover, Jane
wants the houses to be located in a good school district.
She adds a school district node and links it to the house
node (Fig. 5a). Then Jane wants to use the college
attending rate as a criterion to filter the school districts.
However, she could not find it or anything similar listed as
one of the school district attributes in GUI. Not knowing
how to proceed, Jane right clicks on the school district
node to bring up a pull-down menu. She selects “Add NL
constraint” from the menu (Fig. 5a). Triggered by her
action, TAICHI automatically inserts the text “school
district:” in the NL input area, indicating that the NL input
that follows is directly related to this concept (Fig. 5b).
Jane then enters the text “with over 90% seniors attending
college”. Given this, TAICHI automatically completes the
partially constructed visual query and presents the
completed query to Jane (Fig. 5c). Note that in the real
estate database, the “attendingCollege” attribute is not
directly associated with the school district table. Instead, it
is an attribute of the high school table, which can be joined
to the school district table by a has-member relation. This
scenario demonstrates that much user knowledge is often
required to build a complex visual query. A user like Jane
can leverage NL to complete a visual query without the full
knowledge of the database schema or data values.
Figure 5: NL-Aided Partial Visual Query Completion
and school district constraints, she wants to check out the
amenities of the houses. In particular, she wants to see
whether there are any golf courses near these houses.
NL-Aided Full Visual Query Generation
In some cases, a user may use NL alone to build or revise a
visual query. After Jane retrieves houses that meet her city
Figure 6: NL-Aided Full Visual Query Generation
1823
However, Jane does not know how to express “near” in the
visual query interface. Instead, she directly enters an NL
query “show golf courses near them” (Fig. 6a). Upon
receiving this, TAICHI interprets the NL expression in the
context of the existing visual query. It understands that the
referring expression “them” refers to the houses retrieved
in the previous query. Based on this interpretation, TAICHI
automatically generates a complete visual query (Fig. 6b).
Our Approach
In this section, we explain the key technologies that we
developed to support NL-aided visual query authoring. We
start with the visual query composer.
Figure 7: An Example Illustrating the NL Processing Steps
Visual Query Composer
Morphological analysis maps words like “houses” or
“built” to their root forms (i.e., “house” or “build”) to
reduce surface variations. Currently, TAICHI uses a hybrid
approach that combines a dictionary lookup with a rulebased transformation for morphological analysis. In
addition, TAICHI uses patterns defined in regular
expressions to canonize special constructs whose instances
cannot be enumerated in a dictionary. For example, the text
“1/1/2008” in U1 Fig. 7 is mapped to a “DATE”.
Term identification groups one or more words together
to identify terms, each of which represents a single
semantic entity. For example, the two words “New
Rochelle” in S1 Fig. 7 should be grouped together as one
term to represent the name of a school district. Currently,
TAICHI relies on a semantic dictionary to identify
potential terms. Most entries in the dictionary are
automatically mined from databases. For example, the
dictionary entry “New Rochelle” was partially constructed
from the name column of the school district table. Each
entry in this dictionary has two parts: the string index
(“New Rochelle”) and its corresponding semantic tags.
Currently, each tag is represented by a set of feature-value
pairs. For example, one semantic tag for the term “New
Rochelle” is: {<concept: SchoolDistrict>, <attribute:
name>, <value: “New Rochelle”>}. To handle a wide
variety of input expressions in practice, TAICHI supports
partial matches between a user’s input and the terms in the
dictionary. For example, it allows users to use “Hastings”
to refer to the term “Hastings on Hudson”.
Once terms are identified, the semantic tagging process
automatically retrieves one or more semantic tags for a
given term from the dictionary. If none of the dictionary
entries matches, TAICHI assigns an “UNKNOWN” tag.
After semantic tags are selected, the semantic unification
process pieces together the tags of adjacent terms to
identify proper data constraints. For example, after
semantic unification, the tags associated with “built”,
“after” and “DATE” are unified to derive a single data
constraint “house.yearBuilt > DATE” (S4, Fig. 7).
Once individual semantic concepts and constraints are
identified, relation analysis determines the relationships
among them. Our relation analysis is a two-step process.
The visual query composer is responsible for producing the
visual representation of the query graph. We note here that
in order to optimize the user experience across successive
queries, we must minimize the amount of visible change
seen by the user of the visual query interface (i.e., maintain
the visual momentum). The visual query composer
accomplishes this by tracking changes to the query graph,
and then using this information to generate a sequence of
incremental change operators (e.g., add, delete, update
element) that transform the previous visual query into the
current one. Any changes made are visually highlighted on
the display. For example, the visual query generated in Fig.
5(c) is an incremental update of Fig. 5(a).
When determining the visual representations for new
query elements (i.e., those not found in the previous query),
the TAICHI visual query composer employs a rule-based
graphics generation approach. It uses a set of design rules
to map query graph elements (e.g., data constraints) to
visual metaphors (e.g., GUI combo boxes). After all the
query elements are processed, TAICHI sends a list of
visual update operators to the web client to be rendered.
Upon receiving the visual operators, TAICHI’s client
employs a graph layout algorithm implemented in JUNG1
to automatically determine the layout of the new visual
query.
NL Interpreter
To explain the NL interpreter, we first describe our main
NL processing steps. We then focus on how TAICHI takes
advantage of the restricted visual query context to produce
more accurate NL interpretations.
Main NL Processing Steps To create a query graph or
part of it from an NL input, TAICHI uses a six-step
process: morphological analysis, term identification,
semantic tagging, semantic unification, relation analysis
and context analysis. Fig. 7 shows an example illustrating
the first five steps.
1
http://jung.sourceforge.net/
1824
First, TAICHI attaches the identified constraints to
appropriate data concepts based on semantic compatibility.
In S4 for example, the identified yearBuilt constraint is
attached to the House concept, since TAICHI recognizes
yearBuilt a house attribute. Next, TAICHI determines the
relationships among multiple identified data concepts. For
example, in S4, TAICHI needs to derive the relationship
between the House and the SchoolDistrict concepts.
Currently, TAICHI defines the relationships on top of the
database schema.
In TAICHI, users often inquire about data in context.
For example, after a user issued U1 in Fig. 7, she may
follow up with a new query U2: “How about those in
Pleasantville school district?” To derive the full meaning
of a query in context, TAICHI defines a set of context
integration operators that merge the interpretation of the
current query with that of the previous query. During
context analysis, the sixth step of the NL interpretation
process, TAICHI employs a rule-based approach to select
the most appropriate context integration operators (Houck
2004). For example, to derive the full meaning of U2,
TAICHI applies an Update operator to replace the previous
school district name “New Rochelle” in the school district
constraint with “Pleasantville”. Moreover, the follow-up
queries may contain referring expressions (e.g., “those” in
U2). To resolve references in the current query, TAICHI
matches the references mentioned in an NL input to a set
of potential referents mentioned in the query context. To
find the most probable matches, TAICHI uses a set of
matching constraints, including semantic compatibility and
recency constraints.
Due to local and often incomplete knowledge at each
processing step, TAICHI could potentially produce a large
number of interpretation possibilities at each step (e.g.,
semantic tagging and relation analysis). To avoid making
premature decisions, TAICHI keeps all the interpretation
options until it can make an informed decision. To handle a
potentially large number of combinatory interpretation
possibilities in real time, TAICHI now uses a branch and
bound admissible search algorithm. It progressively
explores only the most promising interpretation
possibilities at each step. If in the end, it cannot decide
among the valid interpretations found, it generates a GUI
disambiguation panel similar to that in Fig. 4(b). If no valid
solution can be found, TAICHI generates an error message.
Subsequently, users can interact with the NL or the visual
query panel to revise and correct the interpretation result.
NL Interpretation with Visual Query Context During
NL interpretation, TAICHI often exploits the associated
visual query context to help its NL processing. In
particular, when interpreting embedded NL expressions
such as “along Hudson” in Fig. 4(a), TAICHI leverages the
visual query element that embeds the NL expression to
infer its meaning. In this case, the expression is embedded
in a GUI combo box representing a city constraint. During
semantic tagging, TAICHI only considers semantic tags
compatible with <concept: city> and quickly filters out tags
that are incompatible (e.g., “Hudson” in a house
community “Hudson View”). Similarly, in Fig. 5(a), the
NL expression “with over 90% seniors attending college”
is added explicitly by the user as the constraint of the
School District concept. During relation analysis, TAICHI
attaches the High School node to the School District node.
Without the visual context, it is ambiguous where to attach
the High School concept. According to the real estate
database, the High School node can be attached to three
potential nodes in this visual query graph: House, School
District, and City, since it can be joined with all three
tables. As shown here, TAICHI can leverage a restricted
visual query context to alleviate one of the biggest
challenges in NL interpretation: ambiguities. When a system
does not have enough reasoning capability to make the
correct choice among many possible alternatives, NL
interpretation errors occur. Exploiting the restricted visual
query context explicitly established by the user, TAICHI is
able to interpret a user’s NL input more accurately.
User Evaluation
We have tested TAICHI in several real-world applications
including a real estate and a trade management application.
In the first application, TAICHI was the query front end
for a residential real estate Multiple Listing Service (MLS)
database. In the second application, TAICHI was used to
access the international trade information of our company.
To formally evaluate the usability of TAICHI, we have
conducted a controlled study. Our study was designed to
quantitatively examine the value of using NL in aiding
visual query authoring. We conducted the study in the real
estate domain. Our choice of the domain is mainly dictated
by practical constraints, such as data confidentiality. We
compared the performance of the full version of TAICHI
with that of TAICHI-visual, a visual query-only version of
TAICHI. During the study, we recruited eight employees,
4 females and 4 males. Before the study, we gave each user
a tutorial on TAICHI. We then asked them to complete two
target search tasks, each required six search criteria to be
met (e.g., finding houses with certain price, size, and
location criteria). The order of the tasks to be performed
and the systems to be used for a task were decided
randomly for each user.
NL Usage and Performance
Before we report the evaluation results, we first summarize
the NL usage patterns in the study. Based on our study
logs, NL was shown to be valuable for all the users. For
example, the NL interface was used at least once in each
task by all the users when the full version of TAICHI was
used. Among all the cases where an NL input was
involved, 35.7% of them provided additional constraints,
especially superlative constraints (i.e., with lowest tax);
28.6% were related to inquiring about specific attributes of
a target object (e.g., show the price of a house); 32.1%
were stand alone new NL queries; and the rest (3.6%)
belonged to miscellaneous cases such as error correction.
1825
System
TAICHI
Visual
ElapsedTime
209
352
Reliability
4.56
4.67
how to express their requests in GUI (e.g., a complex
constraint similar to the one shown in Fig. 5). With the full
version of TAICHI, however, a user could easily express
such requests in NL.
Expressiveness
4.67
4
Table 1. Evaluation Results
The NL interface was also proven to be quite reliable.
During the study, among all the NL queries received by
TAICHI, 92.9% of them were interpreted correctly.
Moreover, all the errors occurred when an NL query was
used as a stand alone new query. In these cases, TAICHI
could not leverage the explicit and often constrained visual
query context established by the users. But NL error
correction in TAICHI was easy. Since TAICHI always
converts its NL interpretation result into an equivalent
visual query, users can simply interact with the visual
query interface to correct an error, such as deleting an
unwanted visual query element, adding a missing one, or
changing an incorrect one.
Conclusions
We have presented TAICHI, a novel query interface that
allows users to use NL expressions to aid visual query
authoring. We have explained how TAICHI supports NLaided visual query authoring in three typical situations: 1)
using embedded NL input for visual query element
authoring, 2) using concept-specific NL input for partial
visual query completion, and 3) using stand-alone NL
input to build a full visual query. We have highlighted one
key aspect of our method: NL interpretation using the
restricted visual query context to achieve a high degree of
interpretation accuracy. We have also presented a user
study that demonstrates the advantages of TAICHI over a
visual query-only interface. Specifically, the full version of
TAICHI helps users express their data needs better
(expressiveness) and accomplish their tasks more
efficiently (elapsedTime) while maintaining a high level of
robustness (reliability). This confirmed our initial
hypothesis that NL-assisted visual query authoring would
enhance the usability of a typical visual query interface.
TAICHI versus TAICHI-Visual
To evaluate the overall performance of TAICHI versus that
of TAICHI-visual, we use several well known criteria
previously used in measuring user interfaces: effectiveness,
expressiveness and reliability (Mackinlay, Card and
Robertson 1990; Beaudouin-Lafon 2000). In our study,
effectiveness was measured by two objective values
extracted from the study logs: elapsedTime (the time taken
to finish a task in seconds) and taskSuccess (0 for a failed
task and 1 for a successful one). On the other hand,
expressiveness and reliability were measured based on a
user survey collected at the end of each task. The two
subjective measures were rated on a 1 to 5 scale, 1 being
the least satisfactory and 5 being the most satisfactory.
Overall, all the participants successfully completed all
their tasks using both systems (taskSuccess =100%). As
shown in Table 1, except for reliability, the full version of
TAICHI performed better than TAICHI-visual across all
the metrics. Moreover, even though our study only
involved eight subjects, based on the t-test, the differences
in elapsedTime (p<0.048) and expressiveness (p<0.035)
were statistically significant. The difference in reliability
however, was not significant. Our observations during the
study helped explain why the full version of TAICHI had
significant advantage over TAICHI-visual in elapsedTime.
First, TAICHI’s automatic generation of the visual query
from a user’s NL input saved the user’s time. Especially,
when a user did not know how to use a visual query to
express his/her data needs, s/he just entered NL queries
instead of inspecting all the GUI options. Second,
TAICHI’s robustness in handling NL input also helped,
since it required little user effort/time in correcting
interpretation mistakes. In our study, NL expressions were
often entered in a restricted visual query context. TAICHI
thus managed to achieve a high NL interpretation accuracy
(92.9%). TAICHI also out-performed TAICHI-visual for
being more expressive. From our post-study interviews, we
discovered that in certain cases users simply did not know
References
Ahlberg,C. and Shneiderman, B. 1994. Visual information
seeking: Tight coupling of dynamic query filters with
starfield displays. CHI, 313–317.
Androutsopoulos, I., Ritchie, G. and Thanisch, P. 1995.
Natural language interfaces to databases–an introduction. J.
Language Engineering, 1(1):29–81.
Beaudouin-Lafon, M. 2000. Instrumental interaction: an
interaction model for designing post-WIMP user interfaces
CHI, 446–453.
Blum, A. 1999. Microsoft English query 7.5: Automatic
extraction of semantics from relational databases and
OLAP cubes. VLDB, 247–248.
Catarci, T., Costabile, M., Levialdi, S. and Batini,C. 1997.
Visual query systems for databases: A survey. J. Visual
Languages and Computing, 8(2):215–260.
Derthick, M., Kolojejchick, J. and Roth, S. 1997. An
interactive visual query environment for exploring data.
UIST, 189–198.
Houck, K. 2004. Contextual Revision in Information
Seeking Conversation Systems. ICSLP.
Mackinlay, J., Card, S. and Robertson, G. 1990. A
semantic analysis of the design space of input devices.
HCI, 5(2-3):145–190.
Tang, L. and Mooney, R. 2000. Automated construction of
database interfaces: Integrating statistical and relational
learning for semantic parsing. EMNLP/VLC, 133–141.
Tennant, H., Ross, K. and Thompson, C. 1983. Usable
natural language interfaces through menu-based natural
language understanding. CHI, 154–160.
1826


