Proceedings of the Twenty-Ninth AAAI Conference on Artificial Intelligence
Spatio-Temporal Signatures of User-Centric Data: How Similar Are We?
Samta Shukla
Aditya Telang, Salil Joshi, L Venkat Subramaniam
Rensselaer Polytechnic Institute
110 8th St, Troy, NY 12180
+1-5183346895, shukls@rpi.edu
IBM Research Lab, India
Abstract
Much work has been done on understanding and predicting human mobility in time. In this work, we are
interested in obtaining a set of users who are spatiotemporally most similar to a query user. We propose an
efficient way of user data representation called SpatioTemporal Signatures to keep track of complete record
of user movement. We define a measure called SpatioTemporal similarity for comparing a given pair of users.
Although computing exact pairwise Spatio-Temporal
similarities between query user with all users is inefficient, we show that with our hybrid pruning scheme
the most similar users can be obtained in logarithmic
time with in a (1 + ) factor approximation of the optimal. We are developing a framework to test our models
against a real dataset of urban users.
1
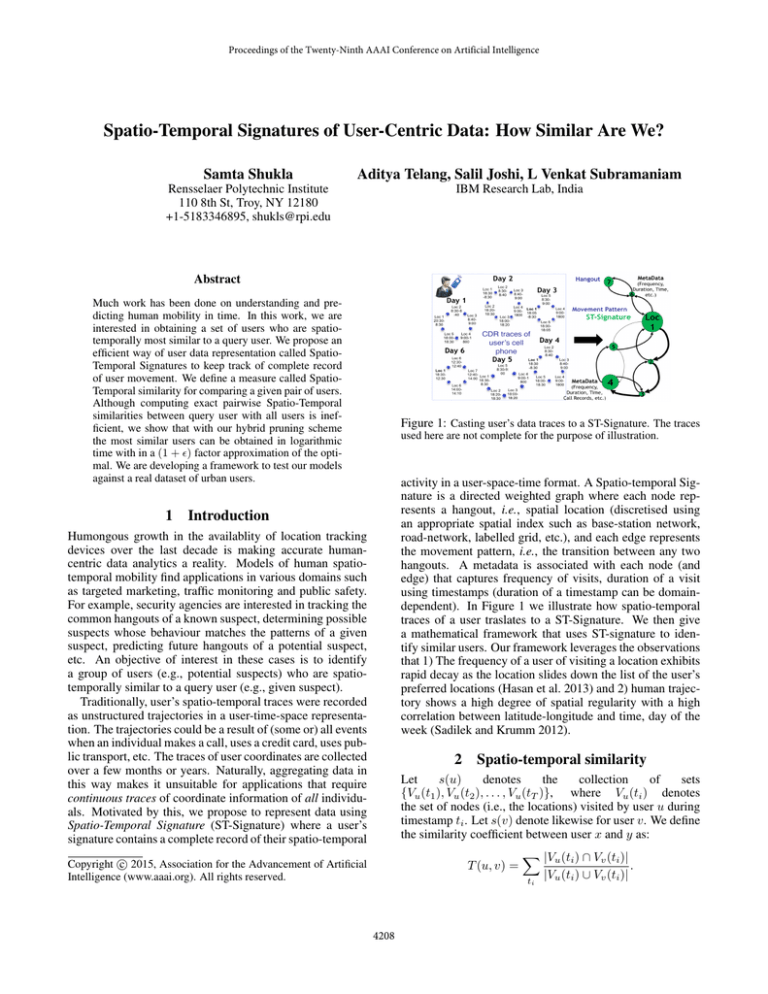
Figure 1: Casting user’s data traces to a ST-Signature. The traces
used here are not complete for the purpose of illustration.
activity in a user-space-time format. A Spatio-temporal Signature is a directed weighted graph where each node represents a hangout, i.e., spatial location (discretised using
an appropriate spatial index such as base-station network,
road-network, labelled grid, etc.), and each edge represents
the movement pattern, i.e., the transition between any two
hangouts. A metadata is associated with each node (and
edge) that captures frequency of visits, duration of a visit
using timestamps (duration of a timestamp can be domaindependent). In Figure 1 we illustrate how spatio-temporal
traces of a user traslates to a ST-Signature. We then give
a mathematical framework that uses ST-signature to identify similar users. Our framework leverages the observations
that 1) The frequency of a user of visiting a location exhibits
rapid decay as the location slides down the list of the user’s
preferred locations (Hasan et al. 2013) and 2) human trajectory shows a high degree of spatial regularity with a high
correlation between latitude-longitude and time, day of the
week (Sadilek and Krumm 2012).
Introduction
Humongous growth in the availablity of location tracking
devices over the last decade is making accurate humancentric data analytics a reality. Models of human spatiotemporal mobility find applications in various domains such
as targeted marketing, traffic monitoring and public safety.
For example, security agencies are interested in tracking the
common hangouts of a known suspect, determining possible
suspects whose behaviour matches the patterns of a given
suspect, predicting future hangouts of a potential suspect,
etc. An objective of interest in these cases is to identify
a group of users (e.g., potential suspects) who are spatiotemporally similar to a query user (e.g., given suspect).
Traditionally, user’s spatio-temporal traces were recorded
as unstructured trajectories in a user-time-space representation. The trajectories could be a result of (some or) all events
when an individual makes a call, uses a credit card, uses public transport, etc. The traces of user coordinates are collected
over a few months or years. Naturally, aggregating data in
this way makes it unsuitable for applications that require
continuous traces of coordinate information of all individuals. Motivated by this, we propose to represent data using
Spatio-Temporal Signature (ST-Signature) where a user’s
signature contains a complete record of their spatio-temporal
2
Spatio-temporal similarity
Let
s(u)
denotes
the
collection
of
sets
{Vu (t1 ), Vu (t2 ), . . . , Vu (tT )}, where Vu (ti ) denotes
the set of nodes (i.e., the locations) visited by user u during
timestamp ti . Let s(v) denote likewise for user v. We define
the similarity coefficient between user x and y as:
c 2015, Association for the Advancement of Artificial
Copyright Intelligence (www.aaai.org). All rights reserved.
T (u, v) =
X |Vu (ti ) ∩ Vv (ti )|
ti
4208
|Vu (ti ) ∪ Vv (ti )|
.
Master graph
1
2
:
Nodes
i
and
:
edges
|V'|
|V'|+1
:
|V'|+|E'|
the number of users remaining can be large. In such a case,
we employ a nearest neighbor-based pruning scheme.
Time-Bucket based representation: From (Sadilek and
Krumm 2012; Hasan et al. 2013), we know that human trajectory shows a high degree of spatial regularity with a high
correlation between latitude-longitude and time, day of the
week. We leverage these well studied results and approximate ST Signatures of each user to a vector in d-dimensional
space (where d is ≈ 20) using time buckets. A timebucket is
defined as a period of time with least spatial activity, i.e., the
time slab when a user is likely to stick to a particular location (such as work hours, staying in home, etc.), for example,
these time buckets could be Noon to 4 PM, 4 PM to 7 PM, 7
PM to 11 PM, 11 PM to 6 AM, 6 AM to 9 AM and 9AM to
Noon. We divide a day into atmost d time-buckets. For every
timebucket ti , we empirically calculate the probability that
a user visits a node v over all days in the collected dataset.
We compare the ST Signatures of two users by comparing
their respective d-dimensional probability distribution profiles. We use geodesic distance measure (a generalization of
straight line based euclidean distance to curved surfaces as
of earths) to quantify the pairwise distance between distributions. Finally, we use an appropriate data structure, such
as k-d tree, to represent the points w.r.t. each user in a ddimensional space. Note that we need to compute the above
clustering just once which is done offline.
Pruning: Once we obtain the query user, we locate the
query user on the data structure (e.g., k-d tree) and compute
the kNN w.r.t. the query. The run time of the algorithm is
O(log N 0 ) where N 0 < N is the number of users obtained
from lossless pruning. Furthermore, we show that our solution, i.e. the obtained top-K users, are (1 + ) factor away
from the optimal due to Liu et al. 2004.
Timestamps
2 17 32 ... j ... 435
29 43 172 496 737
User Indices
Figure 2: The vertical column shows all nodes and edges in the
Master graph; with each node and edge there is a list of timestamps.
At ith node, users reside at node i at time slots 2, 17, 32, . . . , 435.
For each timestamp, we store the list of users available. At the j th
timestamp, User 29, 43, 172, 496, 737 are present.
The value of similarity coefficient equal to 1 implies that u
and v coexisted everywhere, a value of 0 implies that their
signatures never intersect in space-time.
In addition to the above definition of similarity, we also
use distance based similarity (details skipped for brevity) to
gauge the actual distance between users if they are spatiotemporally apart.
2.1
Our Problem
We state the problem as – Given a set N of ST-Signatures of
‘N’ distinct users, and a query user U’s ST-Signature, how
to determine the set of top-K users most similar to U?
Note that the top-K users most similar to a query user are
the users with highest pairwise similarity coefficients (with
the query user). Since computing all these pairwise similarity coefficients can be computationally prohibitive (i.e.,
Θ(N T )), we instead propose a heuristic that employs combination of pruning techniques. Our heuristic significantly
cuts down on run-time and outputs a set of K users within
(1 + ) factor of the optimal set of K users.
3
4
Reducing Search Space
We reduce the search space to a sizeable number by reducing
the number of users with whom a query user is compared.
To achieve this, we propose a hybrid pruning scheme comprising of lossless and lossy pruning.
3.1
Lossless pruning
We construct the Master Signature, M , offline, which consists of all nodes and edges as is shown in Figure 2. When
we obtain the query user, we extract those users who coexisted at least once in space and time with the query user
using M . This significantly prunes users for further comparisons. With hashing, the running time of this step is O(QT )
where Q is the number of nodes in query user’s graph and
T is the number of timestamps. Note that, on an average
O(QT ) is much less than O(N T ) – this is because the number of nodes Q in query user’s graphs (or the number of
locations visited by a query user) is much less than N .
3.2
Conclusion
We propose a mechanism to capture the complete log of
spatio-temporal user traces into Spatio-Temporal Signatures. We define the spatio-temporal similarity between two
signatures. For the problem of finding top-K users similar to
a query user, we advance a computationally efficient hybrid
pruning heuristic to reduce the user search space. We obtain
probabilistic guarantees on the performance of heuristic. We
are currently developing a framework for testing our models
on a real dataset of GPS users in Beijing.
5
Acknowledgement
We thank Girish Kumar for preprocessing the dataset.
References
Hasan, S.; Schneider, C.; Ukkusuri, S.; and Gonzlez, M.
2013. Spatiotemporal patterns of urban human mobility.
Journal of Statistical Physics 151(1-2):304–318.
Liu, T.; Moore, A. W.; Yang, K.; and Gray, A. G. 2004.
An investigation of practical approximate nearest neighbor
algorithms. In Advances in neural information processing
systems, 825–832.
Sadilek, A., and Krumm, J. 2012. Far out: Predicting longterm human mobility.
Lossy pruning
Sometimes even after pruning out the users which did not
co-exist (at least once) in space-time with the query user,
4209


